Archive
MARKET NOTES: US Equity markets at a critical juncture
MARKET NOTES: US Equity markets at a critical juncture
World markets are not in sync, either in terms of geography or asset classes. That’s not been the normal trend for many years. Usually such divergences presage a change in basic long-term trends. Investors should treat these divergences as cautionary signals in their respective markets that the uptrends [or down trends] they have long assumed in effect are about to alter.
Most major markets are fairly close to their all time highs following uptrend in prices that started in March 2009. We are thus in mature bull markets which are fairly late in their fifth wave up. The only matter for speculation is if the markets will make a new high before turning down or simply slip unceremoniously anytime now.
The case for new highs is fairly strong. Firstly, Asia, in particular China and Japan, are breaking new ground and making new highs after having come off what looks like a bottom. Secondly, European equity markets, particularly DAX has broken into new & higher territory. Lastly, the US equity markets, while correcting since 18th December, has not yet violated a level that would negate the rally in prices that began on 16th November.
1375 to1390 on the SPX is a level that markets need to hold through the uncertainties of the fiscal cliff. This represents both the 200 DMA and significant support levels. A violation of the 200 DMA on a closing basis would be a clear sell signal. Investors should use stop losses here even while expecting the rally to resume once the fiscal cliff uncertainty is out of the way.
Commodity markets appear to have launched on another cycle of correction towards new lows that may last 1 to 2 years. There will be intermediate rallies of course but within the overall bear markets that continue.
Gold:

As the above chart shows, gold has broken below both its 200 and 50 DMAs and is supported by the lower channel of a trading range that guided it up since 16th May. Gold closed last week at $1655.90.
Gold can find support on the way down at $1630. Some support also exists at 1590. However, given the tame break below $1660, eventually, a retest of $1525 is almost certainly in the cards in the next few weeks if not months.
Silver:

Silver closed the week at $29.75, well below its first overhead resistance $30.60 and its 50 and 200 DMAs.
Silver could bob along testing its overhead resistance at $31 before eventually moving down to retest $26. On the other hand, there is nothing to rule out a sudden drop $28.5, which is the only significant support between now, and $26.
WTI Crude:

Crude showed surprising resilience in the wake of weakness in commodity markets by rallying almost to its 200 DMA now positioned at $92. It closed the week at 90.80, well below its 200 DMA. Crude has a strong overhead resistance at $93. A rally past that level would negate the analysis given here.
Crude appears to be on course for a retest of $77.50. However, it appears to be in no particular hurry to get there. Nevertheless, the rally in prices now underway may already have terminated or will be terminated by the 200 DMA.
CCI Index:
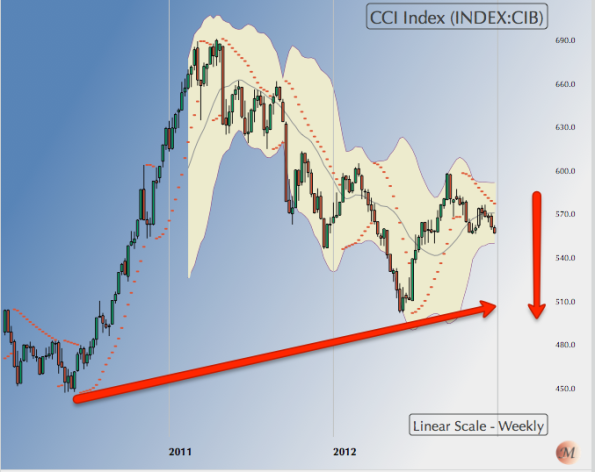
The graph above is the weekly chart of CCI, the Reuters equal weight Index of 17 commodities and is given here to lend perspective to what’s happening in the general market for commodities.
The index went into a long-term correction starting April 2011. It made a low of 500 in May 2012 after the high of 692. After the low of 500, the index could rally only up to 600 before turning down once more. It now is firmly on a downtrend for a retest 500.
A break below the support of 546, imminent any day now, will accelerate the fall.
US Dollar Index [DXY]:

USD Index closed the week at 79.785, just below its 50 DMA at 80.20.
DXY continues to be an intermediate down trend with an eventual target 78.60. However, it is in a counter-trend rally from the low of 79 on 19th December that may terminate either at the 50 or the 200 DMA; the latter being at 80.90.
A more likely terminating point for the counter-trend rally is the down-sloping top of the trading channel in the 80.40 region in case the Index tops its 50 DMA at 80.20.
EUR/USD:

Euro$ broke-out above 1.3170 to make a high of 1.33 on 19th December. It has since pulled in to test the new support at 1.3170.
The correction can continue for a couple of weeks and may even test the deeper support 1.3050 before continuing with the rally.
The long-term uptrend in the Euro$ remains firmly intact even if 1.3050 is tested over the next few weeks.
$-INR:

The $ closed at 54.75 well above both the 50 and 200 DMAs. Note also that the 50 DMA has just crossed over the 200 DMA signaling bullishness in the $ vs INR.
The $ is poised well above the floor of INR 54 and made a high of 55.28 before correcting for a few days.
In the next week or two, the $ is most likely to mount a fresh assault on the important overhead resistance of INR 55.60. If it turns down decisively from there, it will confirm an intermediate downtrend against the INR. On the other hand, on surpassing the 55.60 level the $ will almost certainly test the previous high of 57.30.
S&P 500 [SPX]:
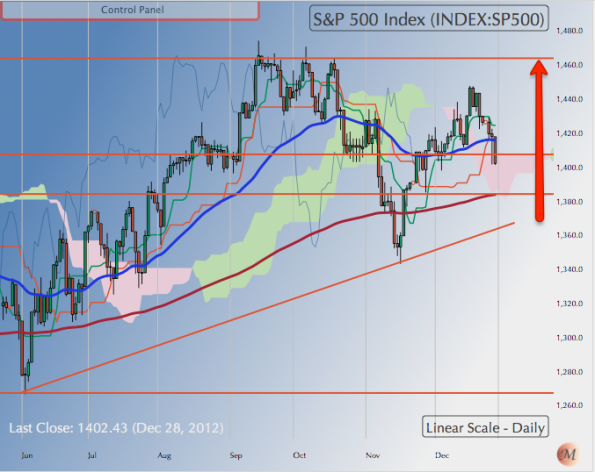
Face the issue squarely. Recognize that the market could already have terminated its grand bull run from March 2009 to the high of 1474 on 14th September. SPX closed the week at 1402, a notch below its 50 DMA.
The point I am making is that we are into a very mature bull markets that is ripe for intermediate term correction. So it is not rare to find technical breakdowns in the uptrend in the wave iv of wave 5 of wave V. Which probably is what last week’s close at 1402 signifies.
That said, bull markets don’t end in a whimper although they obviously can. So I see another leg up that could retest 1474. But be prepared with stop losses just below 1380 just in case.
Shanghai Composite:

Shanghai, and Nikkei 225 as well, illustrate the fact that not all the world’s equity markets are moving in sync, a phenomenon not very rare but equally not very common either.
Shanghai Comp closed the week at 2233, well above its 200 and 50 DMA. The break atop the 200 DMA followed a few days of consolidation above 2140, which was the first “breakout” point. 2233 represents a significant overhead resistance. Cutting through it will open the way to 2500.
NIFTY:

NIFTY appears to be consolidating just above 5830 before making another attempt to clear the 5950 overhead resistance. The index closed the week at 5908.
So far NIFTY’s price action is consistent with 2 alternative scenarios. The first scenario could be that we are in broad wave III down that began at 6348 and possibly terminated at 4544. The present pullback is therefore Wave 4 and will be followed by a wave 5 beginning sometime in February end but could start anytime now.
The second postulates that correction to the last major Bull Run ended in March 2009 and the run-up we have had since then is Wave I of new bull market cycle. Wave II of this new cycle could have then ended at 4543 on 19th December putting us in Wave III of the new bull cycle.
Both scenarios are consistent with a correction in February/March that retests the lows this market can reach. And that scenario ties in with what could be a Wave II correction in the US and world markets.
Either way it is good to buying your favored blue chips at the dips with stops just below 5800 should things go wrong.
Note it will be very hard to tell the difference between Wave V of a bear market down and WAVE II new bull market up. The difference in fact may be just academic at this point though it will make a crucial difference as we get into the later stages of a bull market.
NB: These notes are just personal musings on the world market trends as a sort of reminder to me on what I thought of them at a particular point in time. They are not predictions and none should rely on them for any investment decisions.
Gujarat is not a scalable Model for Modi’s Prime Ministerial Ambitions
Gujarat is not a scalable Model for Modi’s Prime Ministerial Ambitions
The Gujarat electorate has thrown up a conundrum for India that raises deep philosophical questions about the future of its polity. Firstly, electoral compulsions have once again prevailed over the rule of law. The difference between brute mobocracy and a fair democracy is the rule of law. Secondly, Gujarat has again tacitly approved a rather contemptuous message to its minorities that says you are irrelevant. This has implications for national politics. For these reasons alone Gujarat’s political choices need careful scrutiny.
It may be useful to recall BJP’s general electoral strategy of polarization along the communal fault line to generate a larger share of votes for it. I am by no means implying Congress strategy of polarization along caste lines is less harmful to BJP’s polarization along communal lines. Both are terribly debilitating for India. My effort here is more geared to showing why Gujarat cannot be scaled up to India.
For the purposes of a crude but simple model that helps explain the strategy of polarization, consider the total electorate to be made up of 4 blocks. These are Upper Casts [UC], Middle Castes [MC], Lower Casts [LC] and Muslims [M]. The size of these blocks varies from State to State, district to district, town to town. Furthermore, there is significant difference in size and composition between urban and rural areas. Muslims in particular cluster around town & cities and shun rural areas unless they happen to have a significant majority by themselves. For the purposes of understanding the dynamics, assume UC is 20%, MC is 40%, LC is 20% and M is 20%. This roughly corresponds to the caste composition of the Hindus that one observes in practice.
An increase in the degree of polarization works differently on the 4 blocks. A working political assumption is that UCs tend to polarize favorably towards the BJP, LCs and Muslims against. MCs is where the real battleground lies. Note as an initial condition, a majority of UCs is aligned with the BJP, and Ms and LCs against it. So the real gain or loss from an increased degree of polarization comes from the MCs. The other groups are more or less committed in their preferences.
The above configuration, very back of the envelope, gives the BJP roughly 30% of the vote without any polarization. With maximum polarization, the vote percentage goes to about 40 to 45% range. So the real battle for the BJP is to find an emotive issue that polarizes the Middle Casts into voting along communal lines. It helps the BJP to have Middle Cast leadership at the State level to gain some extra leverage. Ever since the Ayodhya affair, BJP has pursued the same electoral strategy without any change.
In Gujarat, Muslims constitute no more than 9% of the population against a national average closer to 18-20%. Other minorities in Gujarat are insignificant at less than 1%. This changes the composition of the Gujarat’s electorate to BJP’s natural advantage. Without any polarization, BJP comes in with a 40% share of the vote compared to others [including Congress] at something close to 30%. No wonder therefore, Gujarat has traditionally been a BJP stronghold. Note issues and electorate’s mood changes from election to election. What we are taking of is general tendencies. Fact is BJP doesn’t need polarization in Gujarat to win. It needs that outside Gujarat. Therefore, Gujarat is a model to be sold to the electorate outside Gujarat – preferably in a different garb – more development rather than naked polarization.
The basic arithmetic changes drastically once you step outside Gujarat. Firstly, the Muslim vote aligned against the BJP jumps to 20%. The degree of polarization required to offset that is much higher because BJP needs to get more than 50% of the Middle Caste votes in order to win as opposed to 25% in the case of Gujarat. Moreover, extreme polarization generates a backlash in lost UC vote share. Under such circumstances, BJP is an under an compulsion to find a Middle Caste leader, well disposed to its ideology, who can pull in the additional votes necessary to put together a winning combination. As we see from history, BJP has done well in States where Middle Caste leaders lead it. Modi himself is a Middle Caste leader, which sort of seals the arithmetic in Gujarat for the BJP. The same play was evident in UP, Karnataka and the BJP alliance with Nitish Kumar in Bihar. When the MCs have their own leader of stature as Mulayam, or Nitish, BJP just cannot find the winning combination on its own no matter what the degree of polarization its ideologues drum up.
With Gujarat not being scalable to the rest of India what options does the BJP have to capture power?
If BJP is to be the main player in a winning coalition, BJP needs a degree of emotive polarization. However, that by itself is useless without an alliance with other Middle Caste leaders. That is the basic reason why we find ourselves in an era of coalition politics. BJP just cannot win on its own steam given the rival Congress strategy of polarization along caste lines. India is locked into divisive politics of one sort or the other.
If the Gujarat model is not scalable, what are Modi’s chances of leading the assault on Delhi? Nitish Kumar, and other Middle Caste leaders like him, will find Modi’s creation of a cult around himself too hard to swallow. Furthermore, aligning with Modi’s hard Hindutva will loose them the critical Muslim vote on which they depend to keep the Congress at bay. Given Congress strategy of coalition building, BJP will have to find leaders acceptable to its potential coalition partners in order to win. And Modi, with his near contemptuous disdain for minorities, together with his strenuous efforts to build a personality cult, has more or less ruled himself out of the game.
Can a softer, more balanced narrative rehabilitate Modi after his power struggle within the Sangh Pariwar is settled in his favor?
Modi faces stiff competition from a gaggle of BJP national level leaders but few of them have his electoral reach or access to corporate war chests. The later is critical in the BJP because central leaders have no separate access to resources that are needed to reward corporate generosity. Their funding comes entirely from regional satraps like Modi.
Furthermore, it is not clear that the Brahmins of Nagpur are ready to surrender their vast cultural organization to a Middle Caste leader like Modi. Note that BJP has no organizational muscle of its own. It depends more or less entirely on the cultural reach of the RSS and its cadres to pull in the voters. RSS is the political party of cadres and BJP the political party of leaders. The latter is nothing without the former. Modi has supplanted BJP/RSS cadres with his own people in Gujarat. Will the Brahmins of Nagpur risk losing their only crown jewel to a relative outsider? This is not a question to be taken lightly. Whatever be its merits or demerits, RSS remains one of the most potent political organizations in India.
Much of Modi’s obduracy towards minorities is predicated on his need to win the battle for supremacy within the Sangh Pariwar. As a shrewd politician with an eye Delhi’s throne, he would have made the appropriate noises of remorse and regret for 2002 long ere this but for the need to keep his firebrand supporters by his side. Modi needs to win over either the RSS or his rivals in Delhi to emerge as the undisputed leader within the Sangh Pariwar. Without one or the other, he cannot win. This triangular contest is what constrains Modi’s emergence as a national leader in his own right.
Modi has various other options open to him one of which is to be less aggressive and perhaps join the collegium of BJP leaders in Delhi and become a team player and bide his time. Provided he mellows down, BJP could then use him as the polarizing factor to lead the Hindutva charge for power. If Modi were to consent to play Advani to a more acceptable BJP leader as ABV, he would give BJP the chance it needs to build a winning coalition with Middle Caste leaders.
Is Modi really larger than his image? If you find Modi retaining his CM’s post in Gujarat & consenting to work for the greater good of his party, you will have your answer.
MARKET NOTES: 22-12-2012: For NIFTY, time to exercise caution till a break over 5950 is confirmed.
MARKET NOTES: 22-12-2012:
For NIFTY, time to exercise caution till a break over 5950 is confirmed.
We live in an era where the metric, money, used to measure value itself is not constant. What we do know is that Central Banks continue to drive their respective currencies down in order to inflate away the real value of their debt & stimulate business with low interest rates. So currency valuations drive asset valuations and the link with underlying cash flows is rather tenuous.
The Dollar continues to drift downward. Correspondingly, the Euro is trending upwards as the EU economies mend quietly beyond the headlines. EU equity markets are into a phenomenal bull run. They will be corrections in due course but for now the bulls is in full command. US politics bogs down the US markets where market hangs on the edge of a cliff. For the nonce, the markets have corrected but show no signs of reversal or panic. On the charts the Bull Run in US markets is in tact.
Commodities appear to have made up their mind to test the lows made in May 2012. That means CRB’s CCI is headed towards 500. No commodity is an exception. Gold for once is acting like any other commodity and may well offer a buying opportunity that comes along one in 3 or 4 years. But investors should be patient. The bottom in commodities could also drag down other risky assets.
Crude is headed for a retest of $78. That has huge implications for India in terms of basic viability, level of subsidies and cost structure of businesses. Crude could stay down for a while. On the other hand, if and when the world markets correct, India will feel the chill. Private banks in India have had a phenomenal bull run that could see a correction. So there is good news for India in the commodity & currency markets, assuming RBI does not go back to its old habit of exporting away jobs to appease those who have one. But until a decisive break above 5950 is printed on the charts [a nick with less than 3% and no confirmation will not do] investors in India shouldn’t be chasing stocks. Buying blue chips, especially those already in a correction, and there are many, would however be okay.
Happy investing.
Gold:

Gold closed the week just a notch below it 200 DMA at $1660.10 after making a low of $1636. With this close, Gold has decisively broken its 200 DMA and confirmed it is traversing a wave 3 down from the top of $1798 on 5th October.
Unless Gold pulls back over its 200 DMA immediately, [an unlikely event,] the unfolding wave 3 would take the metal to a retest of $1525 eventually some time in April next year.
Meanwhile, over the next few weeks, Gold could slip well below $1635 and drift lower towards $1525 region over time.
Silver:

The daily Silver chart above shows the extent of breakdown in price that has occurred in metal prices. [The Gold chart was weekly in contrast to show the wave structure more clearly.] Silver too is the grip of wave 3 down with a target of $26 eventually.
Silver closed the week at $30.20, after making a low of $29.6350. Being relatively weaker than gold the pull back fell well short of its 200 DMA at $31.70.
Over the ensuing week Silver could try to pull back towards $31.50. However, barring such reactive moves, the trend appears firmly down and the metal will try and drift lower towards the $26 region.
WTI Crude:

WTI Crude has been trying to pull back to its 200 DMA since the low of $84 on 7th November. The up-move from there was clearly reactive in nature and crude as turned down from 1st resistance at 90.30, well short of the 200 DMA mark. That betrays price weakness.
Crude closed the week at 88.60. From there first support lies at $84, followed by the floor at $77.30. On a break of 84, crude could head swiftly towards the $78 region.
Going by the wave structure, the floor at $78 may not hold. However there is time for that denouement.
US Dollar:

The US Dollar has been in a fairly orderly correction from its top of 84.24 on 24th July. It closed the week at 79.71 after making a low 79.31.
The US Dollar is clearly in wave C of and A-B-C corrective pattern from its recent top in July. From current levels, first support lies at 78.50. We will know if the correction will go deeper than that by the markets reaction to price at that point. However, given that wave C can extend, one should not lose sight of the deeper floor at 76.50.
Dollar looks pretty bearish from hereon.
EUR/USD:

The Euro closed the week at 1.3180 a nick above its breakout point at 1.3120 after making a high of 1.33080. The pullback to retest the breakout from the topside is constructive price action. The Euro remains firmly in an uptrend.
The next overhead resistance for the Euro lies at 1.3400 followed by a higher resistance at 1.3500.
Over the next few weeks Euro will probably move towards 1.34 level. Expect an orderly move up marked by the usual short corrections.
$-INR:

$ closed the weak at 55.06. As expected, the $ continued to drift upwards towards the major overhead resistance of 55.50. That continues to be the target for the current up move and should achieved over the next two weeks.
What the $ does at INR 55.50 is critical. A lot will hinge on the market’s reaction to price in that region. I continue to favor my old wave count that puts the $ in an up move to eventually retest the previous top of 57.30.
However, the hurdle at INR 55.50 is very strong and a downturn in the $ from there will completely alter my favored wave count.
Shanghai Composite:

As expected, Shanghai [SSEC] made a bid for its 200 DMA and nicked it repeatedly without closing above it. SSEC closed the week 2153, a nick below its 200 DMA.
For the bullish case to hold, SSEC needs to pull down in an orderly fashion 2140 or even 2130 to establish the new floor and then take out the 200 DMA. The Index’s rise has been fast & furious from the low of 1949. So taking a few days of consolidation before a decisive break over the 200 DMA is entirely in order.
The bullish case falls to pieces if the 200 DMA is not held at the next break. There is still some time for a bottom formation within the existing wave structure. So failure to take the 200 DMA is still possible which in turn implies a retest of 1949.
S&P 500:

SPX closed the week at 1430.15 almost exactly at the support but after making a low of 1422.58.
A break above 1430 called for retest of the same level from the topside and that’s exactly what the SPX has done. There is no breakdown in the wave structure and SPX remains bullish with the next target 1465. Stop loss should be at 1400/1405.
NIFTY:

NIFTY has been consolidating just below 5950 within the parameters set by the yellow box shown above. It closed the week at 58.47.50.
Will it bust the 5950 overhead ceiling or 5800 floor first is the million Dollar question. So far the correction from the 5950 high point has been constructive and orderly. The range has been contained between 5800 and 5950. The index is on target to retest 5800 over the next week. Most likely the floor will hold and the index will reverse from there to retest the overhead ceiling of 5950.
A violation of 5800 will negate this analysis. Keep stop loss orders just below 5800.
It is hard at this point to predict if 5950 will be taken out, nicked, or nicked & reversed from there. In many ways the present A-B-C followed by A-B-C up is a way of gauging where the market should go. Only price-volume action will give us clues to the eventual break out. So watch action carefully. There is room for caution as we are in a very mature bull market in the US and a sudden slide there will have ramifications in the NIFTY.
NB: These notes are just personal musings on the world market trends as a sort of reminder to me on what I thought of them at a particular point in time. They are not predictions and none should rely on them for any investment decisions.
MARKET NOTES: 15-12-2012: The Bull Run in world equity markets remains intact.
MARKET NOTES: 15-12-2012: The Bull Run in world equity markets remains intact.
Gold:

Gold closed the week at $1697, a level higher than the previous two lows and well above its 200 DMA at $1664.
Gold hasn’t been as weak as it should have been over the past few weeks. Gold could test its 200 DMA early next week before pulling up modestly towards the $1750 region.
Gold continues in a long-term down trend. The pullback to $1750 region, if it happens, will be reactive in nature before a steeper fall towards $1525. It is difficult to predict when a price collapse will come during the next pull back. Look to sell rallies to the $1750 region.
Silver:

Silver closed the week at $32.29, well above its 200 DMA at $31.75 but below its 50 DMA at $33.
Silver continues in its long term down trend. It too could test its 200 DMA before pulling back modestly to the $33 region. Silver could mark time for a few weeks in the 33 to 31 range.
Silver’s intermediate range target remains at $26.
WTI Crude:

WTI crude closed the week at $86.73, well below both its 200 and 50 DMAs. The long-term trend remains down with a target of $76.50.
Actually, crude’s collapse to the $77.50 region could be in the offing in the next few weeks. Watch for a break in the price below $84.
Crude is looking very bearish on the charts. While $77.50 remains the target, crude may not stop there.
US Dollar Index:

The Dollar closed the week at 79.56, well below its 50 and 200 DMAs. The $ is in a very strong & violent down draft with a target with a target of 78.50 on the DXY. Whether it will get there first or pullback & then get there is difficult to say.
Expect a bit of consolidation above 79.50 early next week before a lunge towards the 78.50 region.
A bearish Dollar and a bearish market for commodities may emerge as the new normal correlation over the next few months!
EUR/USD:

The Euro closed the week at 1.3173, a touch above the previous high of 1.3168 on 14th September 2012. That new high may signal that the correction in the Euro ended at 1.2650 on 13th November 2012.
Watch for a decisive break above 1.32 over the next week. That would put the Euro firmly into an intermediate bullish uptrend with a target of 1.3450 followed by a higher target of 1.35.
A modest pull back to 1.31 before the vault over 1.32 will not be unusual. A fall below 1.31 would negate this scenario.
USD/INR:

The $ closed the week at 54.43 against the INR.
The $-INR pair is well above both it 200 and 50 DMAs. Besides it tested a well-defined support at 54 before turning up. Moreover, the 50 DMA has just crossed above the 200 DMA indicating a bullish move for the $ against INR.
The first target for the $ is in the INR 55.50 region. Given the confluence of bullish signals mentioned above, a move above INR 55.50 cannot be ruled out.
Note however that the outlook for $ in the world markets is bearish. Despite that, the charts indicate the $ is bullish against the INR.
S&P 500:

SPX closed the week 1413.48.
After a higher low at 1344 on 16th November, SPX made a high off 1438 on 12th December breaking above both its 200 and 50 DMAs. Having broken above 1434 [previous high] the index pulled back in an orderly fashion to support at 1410. That’s pretty constructive price action.
Upon further consolidation, another attempt at a rally to previous top of 1475 and beyond can be expected. SPX remains firmly in a long-term up-trend although we are pretty late into a mature bull market. The prognosis for NASDAQ is similar. Skipping NASDAQ for the Shanghai Index this time.
Shanghai Composite:

The Shanghai Composite closed the week at 2150, up 202 points, or about 10.3% higher than its previous low of 1948 on 4th December. That’s a huge move although it doesn’t quite confirm that Shanghai has turned up finally. It’s had a few false signals in the past.
Nevertheless, the index’s 200 DMA lies at 2190, some 40 points away from its last close. A pullback from that region will be entirely in order. The low it makes after nicking the 200 DMA will determine if the index has finally put in a bottom.
In terms of wave counts and time, the index has probably signaled a wave 4 up correction to be followed by another leg down.
NIFTY:

NIFTY closed the week at 5882.80.
The index has been in an correction from the high of 5966 made on 11th December. The correction had a target of 5800, which was probably achieved on 14th December. Over the next week the index could rally modestly to 5900 before retesting 5800.
After consolidating between 5800 and 5900, for a week or so, the index is likely to mount a fresh assault on the previous top of 5960 and may end up breaking above that to aim fort 6000.
The present consolidation can be used to buy into some fundamentally good blue chips including select PSU banks that have lagged the general market. Avoid illiquid stocks late into this rally.
NB: These notes are just personal musings on the world market trends as a sort of reminder to me on what I thought of them at a particular point in time. They are not predictions and none should rely on them for any investment decisions.
The bull run in equities continues & commodities may have turned down again
MARKET NOTES: 08-12-2012: The bull run in equities continues & commodities may have turned down again.
Gold:

Gold closed the week at $1705.50.
The above is a weekly chart of gold from its all time peak of $1920. Gold last significant bottom was $1525 on 15th May. The rally from that point to $1800 on 4th October looks like a pull back. Gold then pulled in from $1800 to its 200 DMA and rallied as expected. But the rally fizzled out much below 1800 and the metal has since fallen from $1755 to a low of $1693.
From the wave count beginning at $1920 top, we have a count that suggests the recent top of $1800 being the beginning of the wave C of the correction now underway. Counting off from there, we are in wave 3 and sitting just atop the 200 DMA at $1650.
Over the next week or two, gold is likely to test its 200 DMA and in all probability breach it in a couple of attempts. On a breach of the 200 DMA at $1650, the next logical target for gold becomes $1525. In effect we are back to the old long-term bearish wave count.
Silver:

Silver’s case follows that of gold. It closed the week at $33.13. It is likely to test its 200 DMA at $31.70 over next week & a breach will open the way to the previous low $26.

Crude closed the week at $85.93. Have been compelled to revise my wave counts completely for crude. Note crude failed to peak in April/May 2011 unlike most other metals/commodities. After weighing all things, one has to concede that weakness in the crude vis-a-vis other commodities. Once you do that, crude falls squarely into the wave pattern for other commodities.
We are into the second half of a Wave III down that can test & breach 78 again. A breach of 78 has humongous repercussions for the rest of the markets. Stay tuned to this commodity for further clues.
US Dollar:

The Dollar has been correcting down since the top 84.25 on 23rd July. It made a low of 78.60 in mid-September and has since retraced almost 50% of the fall before turning down again from a lower level of 81.50. That puts the $ wave c of a correction that cud see it retest 78.50.
At the fag end of last week, the $ pulled up sharply from 79.50 to close the week at 80.25, which happens to be its 200 DMA. Most likely the Dollar will turn down from here once again and resume its decent to 78.50.
The correction will likely resume its trend down early next week, probably Monday.
EUR/USD:

EUR/USD has been in an uptrend since the low of 1.20 on 24th July 2012. Since then it has made a high of 1.31 on 14th September but failed to hold that high 18th October the second time. Since then it has corrected down to 1.265, up again to a lower high of 1.3090 and closed the week at 1.2924.
The action since July 2012 suggests a bullish top at 1.30 on 17th October followed by Wave A of the correction to 1.2650. That puts EUR/USD in wave c of a B wave that could see it test 1.2650 again.
If 1.2650 holds, as I expect it to, we would have confirmation of the uptrend in the Euro. A breach would negate my wave count. Watch for a breach of the upward trend line for the first sign of distress.
$-INR:

During the week, $ fell to a low of INR 54 before closing the week at 54.33. 54 happens to be both the 200 and 50 DMA of the $ against INR. The $ could turn up against the Rupee from here and resume its uptrend.
However, as shown by the yellow arrow on the weekly charts above, there is room for the $ to weaken against the INR further to 53. However, even in such a case, I expect the $ to turn up again and retest the overhead resistance of 55.50.
NASDAQ Comp:

NASDAQ is probably in the wave 5 of Wave V albeit in the early stages. It closed the week at 2978 after turning up from a retest of its 200 DMA from the topside. The price action so far is constructive and the next target 3040 followed by 3100.
The index’s passage up to its previous top of 3200 should be orderly despite the Apple shenanigans, which is a major component of this index.
Keep stops just under the 200 DMA.
S&P 500:

SPX, like the NASDAQ is in wave 5 of Wave V, albeit in the early stages. It closed the week at 1418 just under a significant overhead resistance at 1420.
Barring a small correction down to 1380, there is nothing much that can go wrong with the uptrend in SPX at this point. On the other hand a vault over 1435 will put the SPX with in the reach of the previous top at 1475.
Note SPX is the strongest of the US indices at this point because of the presence of a large number of financial firms in the index that benefit from ultra low interest rates and pick up in business activity.
CNX NIFTY:

NIFTY pulled in exactly from its major overhead resistance at 5950 to close the week at 5907. NIFTY can continue to correct to test to test its new floor at 5800 before resuming its uptrend.
The next major hurdle once NIFTY vaults over 5950 is 6160. So a break atop 5950 will have significant repercussions for retail participation in the rally underway.
Investors may keep sliding stops. For the current correction the stop should be 5750 and slide that to 5810 once NIFTY pierces 5950 and so on & so forth. Happy trading. Note within NIFTY, as in SPX, the strongest group of stocks is financials at this point.
NB: These notes are just personal musings on the world market trends as a sort of reminder to me on what I thought of them at a particular point in time. They are not predictions and none should rely on them for any investment decisions.
MARKET NOTES: 01-12-2012: Equity valuations headed up
MARKET NOTES: 01-12-2012: Equity valuations headed up.
Gold:

Gold has been correcting from its recent top $1795 in October 2012. It made low of $1672 in November that was just above its 200 DMA, and thereafter topped out 1754 after piercing its 50 DMA. Since then its been consolidating above $1700 but below its 50 DMA which is currently at $1740.
As noted in the last week’s post, gold is now in an intermediate uptrend whose logical target on the upside is the previous top of $1925. Going by the wave counts, the correction from the recent top of $1795 is over and we are now building a base just above $1700 for the next leg of the rally. Bulls may keep stop loss at the 200 DMA, which is currently $1650.
Silver:

Superficially, Silver looks like it is in an intermediate uptrend like that of gold, which is partially true. However, the uptrend in Silver is structurally much weaker in momentum and duration than gold.
Silver is currently placed at $33.15 just at its 50 DMA, unlike gold, which is below its 50 DMA. That’s more because the long-term down trend in Silver has been much stronger in Silver than in gold rather than silver being the stronger metal.
I expect Silver to move sideway for a few weeks below its recent top of $35.50 but above its 200 DMA, which currently is at $31. Silver will mimic gold in reaching for the pervious top but with a lots more volatility and lag. Avoid the metal till it builds a base above 31-32 range.
WTI Crude:

Crude has been in an uptrend since it hit $77.28 on 28th June. Since then it topped out at $99.44 and has been correcting since hitting a low of $85.42 on 6th November.
In my view this correction is now complete both in terms of time and price and crude is likely to drift upwards to a first target of $93, which is also its 200 DMA area.
First confirmation of the $93 target will come when crude tops its 50 DMA now at $89. Bulls may keep a stop loss at $87.
US Dollar:

Weekly charts in currency trading are rarely used but we are looking to understand once in a 50 years cycle triggered by unprecedented Fed actions. So looking at long-term trends is not entirely out of place to get a perspective on what’s happening in the market place.
The above chart shows the $ in a decline from the top of 89 to a low of 73 over a period of 12 months starting June 2010. Over the next 12 months, from June 2011 to July 2012, the $ managed to claw back about 69% of the drop from 89 to 73 and has been falling since then.
This decline from 89 is itself the C wave of a larger decline of the $ from 128 in December 1985 to the low of 72 in April 2008. So we are at the fag end of a wave C down whose logical target is 71. Hard to say if it will get there but the long-term down trend has most likely reasserted itself.
The $ is below both its 200 and 50 DMAs and is currently at 80.16. Its next target is 79.70 followed by 79. A fall below 78.50 will be the first confirmation of the above long-term prognosis. Until then one should presume the $ is headed for a retest of 78.50 in a fairly routine correction.
Euro$:

Since we are looking at long-term currency trends, we might as well note that pullback of the Euro$ to the 1.35 region or above would not be out of place in its current intermediate uptrend. The correction in the Euro from its recent top of 1.31 is likely over 1.2650. The next logical target for the Euro is 1.3175. The long-term scenario will come into play if, and only if, it sustains over 1.32 for some time. Do remember that this more a pullback rally for the Euro and not an impulsive bull wave.
$-INR:

As expected, the $ met with a strong overhead resistance at INR 55.50 and reacted sharply from there and closed the week at 54.26. The next support for the $ lies at its 50 & 200 DMA both of which are positioned at 53.80. A failure to hold that level see the $ testing 51.50.
The more likely scenario of the $ against INR is a triangulation from the top of 57.50 and the low 51.50 as players try to discover the price. Remember the $ itself is likely to be very volatile & its value against the INR is partly a “derived” price. Interesting times ahead.
NASDAQ Comp:

You can talk yourself blue in the face debating the merits of central bank intervention in markets. But the converse of currency debasement in asset price inflation without being matched by growth in earnings immediately. Are we likely to see that phenomenon? I leave that debate to fundamentalists.
The technical are however straight forward. By reversing from the low of 2810 and piercing through both the 50 and 200 DMAs at 2950, the NASDAQ has just signaled a resumption of the uptrend and wave 5 of wave I from the lows of March 2009. Too early to guess what the target could be but waves_5s are not only violent but also surprise in strength and duration.
S&P 500:

The wave count for the SPX is straightforward; some would say too straight forward! Like the NASDAQ, SPX too reversed from the rally’s base trend line and then went right through the 50 and 200 DMAs.
SPX closed the week at 1420, a key overhead resistance. If it crosses and sustains over 1430 next week, the next logical target becomes the previous high of 1475. Too early to call where SPX will eventually end up but the uptrend is firmly in place.
NIFTY:

While the wave count for NIFTY looks analogous to that of the NASDAQ and SPX, it is quite a different animal and may in fact be just wave III imbedded in a larger wave up from the low of 4525 registered in December 2011.
NIFTY closed the week at 5880, a notch above the recent high of 5817 registered on 5th October. We can expect NIFTY to come back and test 5810-20 as a support before moving on further.
The next logical target for the NIFTY is 5950, followed by 6175. Barring the usual corrections on the way, NIFTY too appears to be firmly in an uptrend the top of which is too early to call.
NB: These notes are just personal musings on the world market trends as a sort of reminder to me on what I thought of them at a particular point in time. They are not predictions and none should rely on them for any investment decisions.
