Archive
MARKET NOTES: NASDAQ 100 & SPX make new all time [closing] highs while DAX sags
MARKET NOTES: NASDAQ 100 & SPX make new all time [closing] highs while DAX sags
Markets showed considerable divergences during the week with Asian & EU markets continuing to correct as expected while the US markets turned around and made new all time highs on a closing basis.
One needs to confirm the new highs in the US markets. This the markets will do in the normal course by rallying a bit further and then testing the previous top as the new support. Until that happens, there is no call to jump into the markets as new bulls. Likewise, the old caution to early bears is worth repeating. Unless the markets confirm a downtrend, don’t short the markets. Investors should wait till a direction to US markets becomes clear.
Elsewhere commodities continued to correct as expected, the contrary moves in crude notwithstanding. These corrections can be quite violent as the price collapse in Corn & Lumber demonstrated. Crude may not be the exception it pretends to be. Corn was deceptive enough to warrant caution. Precious metals too are poised on the threshold of major downsides.
There were no surprises in the currency markets. The Euro could test its new support at 1.27 or perhaps even 1.26. Likewise the USDJPY could resume its rally from 94 or 93. DXY itself may test its previous high at 84.25 soon though it may not be taken out in two or three attempts.
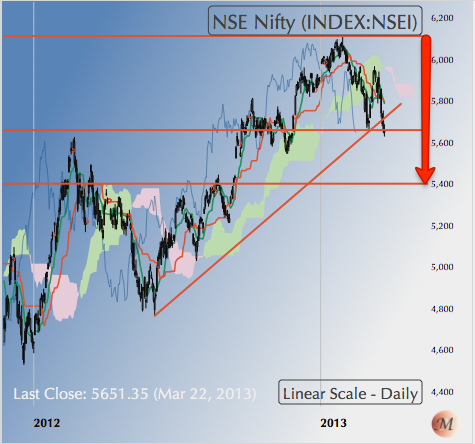
NIFTY continues to correct in an orderly fashion with a possible downside target of 5400. I still favor buying the doom & gloom in old economy stocks that have been correcting since December 2007 and are near their long-term supports. There is hardly any negative news out there that hasn’t been factored into their current prices. Stick to blue chips!
Gold:
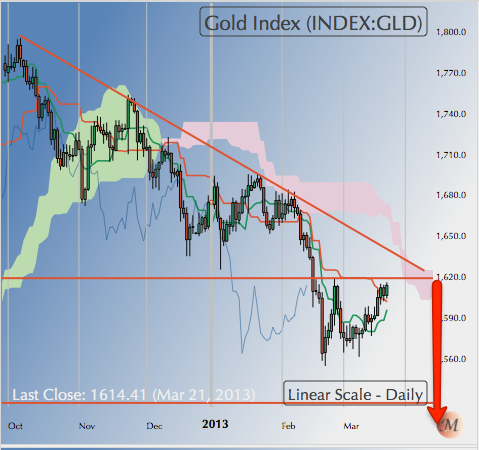
Gold continues in a downtrend from its recent high of $1620 and closed the week at 1595.70 after making a low of 1588.40 during the week.
Gold in the final leg of its correction from its top of 1800 in October last year and the target for this leg is $1525. Expect gold to test 1570 during the week and if that support doesn’t hold, a further fall to 1525 is possible.
Silver:
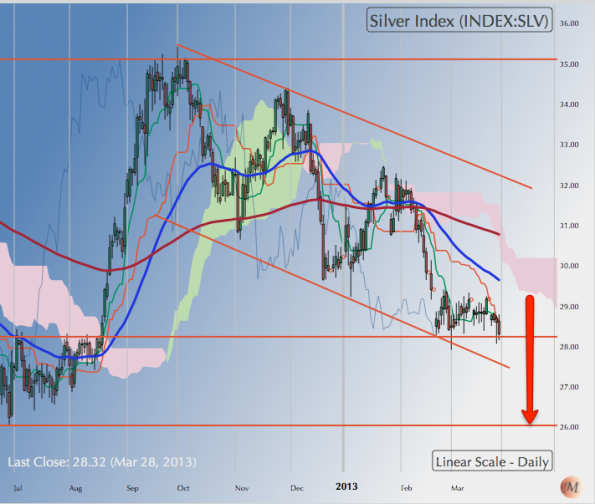
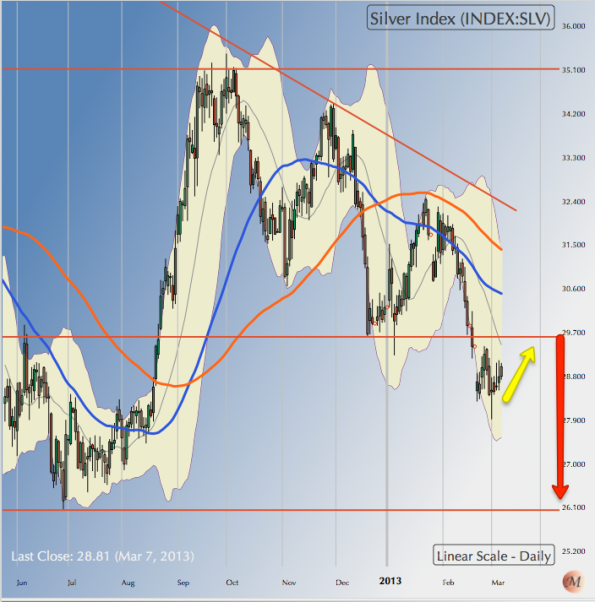
Silver closed the week at 28.32 just above its support at $28.
On a breach of 28, Silver can head down to $26.
However, note that there is little to support Silver between $20 and $26. So a breach of $26 has major significance for Silver. My sense is that it would be unwise to assume $26 will hold.
HG Copper:
HG Copper closed the week at it support of 3.40. You can’t get more technically correct than that!!
My sense is, barring a small bounce from 3.40, Copper is headed lower to test 3.25 levels over the next few weeks as Shanghai Composite in China continues to correct. Knowing the Chinese, don’t bet on 3.25 holding 😉
WTI Crude:
WTI Crude closed the week at $97.23 moving against the general trend in all commodities, which are correcting downwards in line with the correction in the CRB CCI Index.
I am very skeptical & wary of the contrarian price moves in crude. My sense is that crude could pullback 98.25 but is more likely to fall towards $84 rather continue upwards.
This analysis would be negated by a decisive breakout above $100. Despite the ambiguous wave count, I am inclined to the bearish view in crude & favor a fall to $84.
US Dollar [DXY]:
DXY continue to be in a strong uptrend towards it previous high of 84.25 and closed the week at 83.175.
DXY could consolidate above 83 for a few days more before making an attempt to take out 84.25. If it does take out 84.25, as I expect over the next few weeks, the next overhead resistance then falls at 85.50.
EURUSD:
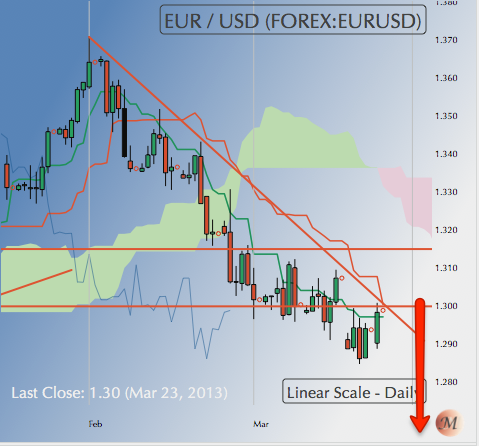
EURUSD closed the week at 1.2818 after making a low of 1.2750 during the week.
There are few days more to go for the correction in EURUSD, which could see it taking out the 1.27 level, which was my target for this correction. Upon nicking 1.27, the EURUSD could show a decent rally to its 200 DMA at 1.29.
But first let the EURUSD get to 1.27 or perhaps even 1.26.
USDJPY:
USDJPY closed the week at 94.19 Yen.
My sense is that the correction in USDJPY from the high of 96.71 may be over or is at worst likely to test its 50 DMA at 93 before the Dollar climbs back towards 97 Yen.
A decisive breach of 93 Yen will negate this analysis. Keep handy stop loss just below 92.50.
USDINR:
USDINR closed the week at 54.28 just under its 200 DMA.
The Dollar has shown marked reluctance to pierce the 200 DMA upwards for the past few weeks. On piercing the 200 DMA to the upside, USDINR could see 55 INR although the probability of such an event is low. The more likely possibility is for USDINR to test support at INR 54 and if that gives way, to test 53.50.
Unless the $ decisively breaks above the 200 DMA over the next week, my expectation of a rally to the 55 mark is likely to be belied.
DAX:
DAX closed the week 7795.1, just a touch above its 50 DMA.
DAX can extend the fall all the way to 7600 before attempting a decent rally. On the other hand it could rally towards the previous top from the 50 DMA itself. In either case DAX will have to make a new high in the next two weeks to negate the downtrend that started from the top of 8074. And until it does so convincingly, the main trend remains negative.
NASDAQ 100:
NASDAQ 100 closed the week at 2818.69, a new high negating my expectation of a top having been made at 2810.
Rather than jump onto the bullish bandwagon I would wait for a confirmation of that the previous top of 2810 is now the new floor. In the normal course, NASDAQ 100 can be expected to continue its rally to 2830 or so and then correct to test 2810 as the new support. Until that test is convincingly passed, I would treat the “breakout” with extreme caution.
S&P 500 [SPX]:
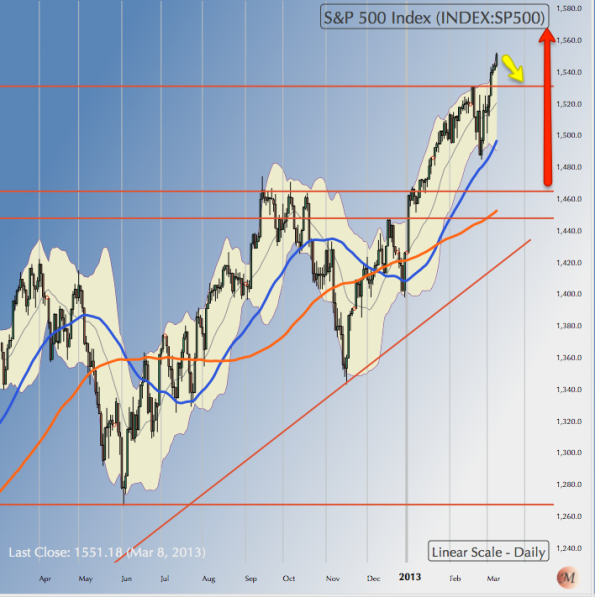
Contrary to my expectation that we had seen a top in the SPX at 1563.50, the index turned around and closed a new high of 1569.19. One doesn’t argue with a new all time high never mind the poor volumes. But one must not throw caution to the wind either.
Like the NASDAQ 100, we must expect SPX to rally a bit more, perhaps 1575 or a bit higher and the come down to test 1563 as the new support for the market. Until the previous top holds as the new support convincingly I would treat the new top with circumspection.
NSE NIFTY:
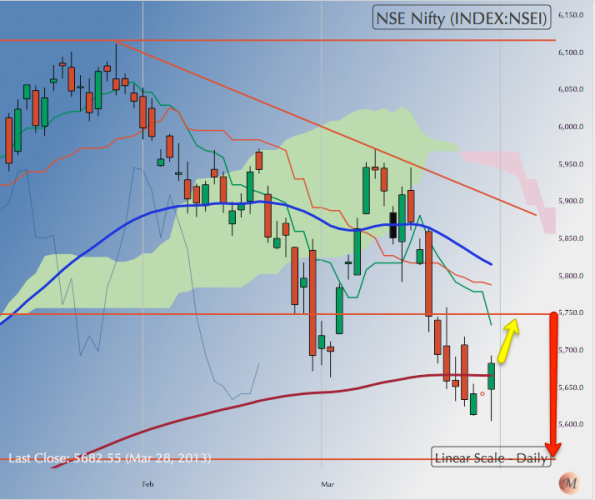
NIFTY closed the week at 5682.55 just a notch above its 200 DMA.
Barring minor pullbacks, the correction in the NIFTY can continue till the third week of April and may ultimately test the Index’ main upward sloping trend line from 2003 that lies at 5400.
A breach of the 200 DMA early next week will more or less confirm that we are going to 5400 before we see a decent rally.
My analysis would be negated if the NIFTY were to pullback above 5800 in line with the new highs in the US markets.
NB: These notes are just personal musings on the world market trends as a sort of reminder to me on what I thought of them at a particular point in time. They are not predictions and none should rely on them for any investment decisions.
MARKET NOTES: World Markets treading on Egg Shells
MARKET NOTES: World Markets treading on Egg Shells
DAX has clearly been the strongest index in the EU equity markets. It represents the most robust of all the EU economies. DAX commenced a correction from the high of 8075 on 15th March that continues. There could be a bounce in the offing from 7850 but unless this bounce makes a new high, [very unlikely in my view] the index is an intermediate downtrend that could test 7500 followed by the index’s 200 DMA currently at 7250. Where DAX goes, other EU markets follow.
The US markets present a more robust picture than the DAX. However cracks in them are apparent. Firstly, the NASDAQ 100 made a high of 2878 on 21st September. After its subsequent low of 2494 on 16th November, the index still hasn’t been able to make a new high. The time for doing so is running out. Meanwhile the index has gone into another short correction from a lower low of 2816. That doesn’t confirm an intermediate downturn but it points to weakness. The index could be testing 2700 soon.
SPX is better placed than NASDAQ 100. It could go on to make a new high but has to correct before long. Note it doesn’t need to make a new high for the long-term bull market to continue. An intermediate correction could easily see SPX testing 1420.
Meanwhile, DXY is all set to resume its uptrend against the Euro & the Yen. It is strong in terms of DXY as well. As the Dollar rallies it will tank the commodities into deeper corrections. Precious metals are likely to be severely hit.
With DXY trending higher, commodities tanking, equity markets weakening & interest rate cycle having turned higher, one cannot avoid the sense that a mother of all corrections is due any time now. There could be a lot of blood on the carpet since almost every asset class will be correcting simultaneously.
Avoid leveraged positions like the plague.
US Dollar [DXY]:
Dollar Index [DXY] closed the week at 82.59. DXY has been correcting from its recent top at 83.30 and in terms of wave counts, it has more or less completed its correction although it could see a lower low of 82 early next week.
Over the longer time frame, Dollar continues to be in a strong bullish uptrend that could resume any time next week vaulting the Dollar over its recent top of 83.30. Buy the Dollar dips for more reason than one.
EURUSD:
EURUSD closed the week at 1.2985 after having nicked its 200 DMA and made a low of 1.2843. The pullback from the 200 DMA is rather tame and the move reactive.
Expect the EURUSD to resume its downtrend early next week to first test its 200 DMA at 1.2880 and upon piercing that, to look for support around 1.27 which was my target for this correction.
USDJPY:
USDJPY closed the week at 94.50. The pair has been correcting from its recent top 97.70 is nearing it end for now. Yen could resume its uptrend early next week, consolidate a bit just under 97 before resuming its uptrend.
My target for this long-term rally in the currency pair lies in the region of 102 where it will meet the down-sloping trend line from the top of 280; a very formidable overhead resistance. BoJ is reversing policy after decades & rightly so in my view. We need to understand the dynamics of internal debt for an economy far better than we do now.
USDINR:
USDINR closed the week at 54.34, just above its 50 DMA and just under its 200 DMA. Paradoxically, the Dollar depreciated from 54.50 to 54 even as the equity markets continued to tank! That shows the Dollar moves in the Indian market more in line with its “value” in terms of DXY rather than reflecting the cash flow in FII investment accounts.
That said, the correction in DXY is more or less over. USDINR has basically no clue where it’s going and has been triangulating to find direction. My sense is that it will head for 55.50 as the DXY rally gathers steam. Very poor policy from RBI. They should send a few senior officers to China for some training on how to manage the exchange value of a currency to create new jobs for the young. The Central Banker there got a 5-year extension for the excellent job he has done over the last 10 years.
Gold:
Gold closed the week at 1606. Gold basically pulled back from 1560 to test resistance at 1620 & create some room for a plunge through its floor at 1525. The downtrend could resume early next week.
Silver:
Silver like Gold is a no brainer. It closed the week at 28.70. Silver has been consolidating just under its resistance at 29.50 before taking the plunge below 28 and then test 26. I would be very surprised to see @26 floor hold up.
HG Copper:
Copper closed the week at 3.466, well below its 50 and 200 DMAs. In terms of price, Copper can see a lower low of 3.25 but my sense is that long-term players will be looking to buy these levels rather than sell. In terms of time, Copper will continue to mimic the moves of the other metals. It just that it got to its target faster than other metals!
WTI Crude:
Crude has been consolidating just above its 200 DMA and under its 50 DMA, closing the week at 93.71. It is one of the “strongest” in the commodities basket. It is not immune from corrections but most of them have been fleeting since the low of $77.
Crude can correct $89 in the ensuing correction with all the other commodities. It is hard to see it fulfilling its target of $84 for this correction. I would look to buy dips below 90.
NASDAQ 100:
Warning: This not a crash, just a correction. One would expect another attempt to rally after this current correction that could go as low as 2700 from its current level of 2808. The index’s 200 DMA is also positioned in the same region.
Note that the rise in the index from 2500 is largely being fuelled by early bears & not fresh buying. When the fuel runs out is hard to predict. The current dip underway should provide a few clues. Take the garbage out.
S&P 500 [SPX]:
SPX closed the week at 1556.89. The index is the same boat as the NASDAQ 100. It correcting to test support at 1530 but the correction could easily stretch to 1485. What can be said is that there will be a rally from either 1530 or 1485 that aims for the previous top. Whether or not it makes it there depends entirely on who capitulates first – the bulls or the bears. I would not buy the dips in this correction till I see a convincing bounce from the 200 DMA currently at 1420.
DAX:
DAX closed the week at 7911.35. My reading of the charts suggests that DAX has started on an intermediate downtrend that could see it testing 7460 or even lower levels. Warning, DAX is known for its vertical drops and so the levels can be very deceptive.
NSE NIFTY:
NIFTY continues in an intermediate downtrend closing the week at 5651.35 just a touch above its 200 DMA, which is currently 5615. NIFTY may show a decent bounce from 5600 but will likely continue its correction in line with other world markets. Once it falls through 5600, NIFTY has support 5400 and then finally at 5200, the latter being a very long term support line stretching back to 2003 and unlikely to be breached.
NIFTY has anticipated the world markets. In my view it is a buying opportunity with many stocks having bottomed out already. Investors should use the opportunity to buy blue chips in these times of doom & gloom. I would especially focus on those stocks that are completing their corrections from the top of 2007. These are likely to be the best performers in the next cyclical uptrend.
NB: These notes are just personal musings on the world market trends as a sort of reminder to me on what I thought of them at a particular point in time. They are not predictions and none should rely on them for any investment decisions.
MARKET NOTES: US & EU markets continue to make new highs as Asians take a breather
MARKET NOTES: US & EU markets continue to make new highs as Asians take a breather.
Last two weeks of trading in world markets have confirmed two trends. Firstly, confirmation that the interest rate cycle has turned up. [The details are in the accompanying chart and commentary.] As the surge in yields gathers momentum, it will change all asset prices across the board & disrupt all lazy assumptions of asset price correlations. New models will have to be built anew. Secondly, the mighty Dollar has confirmed [well very nearly so] that it too is in a bull run that could see it testing 90 over the next 12 to 15 months. These shifts are like the shifting of tectonic plates. They are small gradual, almost imperceptible shifts to begin with, but trigger unpredictable quakes that question every possible assumption.
The big issue of course is gauging if the markets have peaked? This rally has been on an extended life for so long that one has to go back and think afresh about what might be driving it. Bull markets don’t end in a whimper is an old tested saw. Frankly I expected an intermediate correction towards the end of February that would be shallow but extended in time without terminating the bull market. But the market thinks it has enough steam to power past May and could possibly extend well into Mid-August! The rally in the mid-cap space shows equities are under owned in the retail space and that is too much of an opportunity for the bulls to relent early.
I see no profit in chasing stocks. I would still recommend taking the garbage out while sticking with blue chips. One could buy decent stuff like IBM or even MSFT as it breaks out of a long correction. Once markets go parabolic they also correct just as sharply & my strategy is always to buy doom & gloom & sell slowly into the Euphoria.
Investors in India have a great buying opportunity in cyclical stocks that have completed their long corrections from the peak of 2007. There are many blue chips among that universe of banks & old economy warhorses. I would buy them at bargain prices they are offering.
For those who asked, there is my twobit on strategy for trading Apple.
Yield on 10-Year USTs:
Whatever the Wall Street rhetoric on “no evidence of great rotation” to “no major change in interest rates” solid evidence above points to two incontrovertible facts. Firstly, that yields on 10-year USTs bottomed out at 140 basis points in July 2012 and have consistently headed up since then.
Secondly, the yields have now moved from the 140-to-180 trading range to the next higher range of 180-to-230 basis points. The moves have coincided with a stronger DXY in the FX markets. Ignore the evidence at your peril. The fact remains, that at some point, the surging yields are going to affect asset valuations across the board.
US Dollar [DXY]:
DXY closed the week at 82.256 after making a high of 83.18 during the week. The Dollar’s orderly pull back to support after making a new high in this rally speaks of its inherent strength.
In the ensuing week, we can expect the Dollar to consolidate above 81.95 for a couple of days before resuming the trend higher. Maintain my view that the Dollar is destined to a new high beyond 84.13 in the next 2/3 months.
The positive correlation between rising yields & a resurgent Dollar should be noted.
EURUSD:
The Euro closed the week at 1.3074 after making low of 1.2910, which happens to be a touch above is 200 DMA.
The Euro has been correcting down from its recent high 1.3712. A pullback before taking out the 200 DMA would be in the fitness of things in this correction. I see the Euro consolidating just under 1.3220 for a few days before taking out the 200 DMA at 1.28 approx.
However I do not see the Euro significantly lower than 1.27 in this leg of the correction never mind the usual “Europe is collapsing” din.
USDJPY:
The Dollar continues its strong surge against the Yen closing the week at 95.28 Yen. There is no end to the rally in sight on the charts despite the near parabolic surge of the Dollar.
However, the Dollar has clearly decided to test its old overhead resistance at 95 as its new support and this can solidify in the ensuing week before the Dollar resumes its surge.
USDINR:
The Dollar continued to triangulate between the two vertices formed by it all time high at 57.25 and the recent low 51.65. It closed the week at 54.02 a nick below its 50 DMA and well below its 200 DMA at 54.63. The Dollar’s correction is correlated with its correction in the international markets from a high of 83 to 82. The $ fell in the Rupee market despite the weakness in the equity markets.
Be that as it may, the $ can correct down to 53.50 or even lower in the early part of next week but should resume its upward trend towards the previous top thereafter. Note DXY is exactly at support.
Gold:
Gold closed the week at $1590.70. The metal could move sideways in the 1620-1550 range for few more weeks before it tests its support at 1525.
Despite the display of “strength” just above 1525, there is nothing bullish about Gold. The “pullback” 1554 has been rather muted. My sense is that the longer gold hovers above 1525 the deeper will it will fall below 1525 eventually. Long-term bulls may note that Gold is signaling a very bearish wave count for the long term.
Silver:
Silver closed the week at $28.85. Much like Gold, Silver’s pullback from its recent low of 27.92 has been very muted.
To add to the woes of precious metal bulls, Silver also signaled a death cross with its 50 DMA moving decisively below the 200 DMA. Silver could make a wild dash to its 200 DMA at $31 though the odds look slim. In my opinion, the metal is just building a base to take out the $28 support in the next ¾ weeks.
HG Copper:
Copper closed the week at 3.52, just under its 200 DMA.
Copper is in a downtrend from its recent top of 3.8 in what appears to the last leg of its correction from 4.6 in February 2011. The metal’s coyness just above 3.4 could be misleading. First support for the metal lies at 3.4 followed by another at 3.20. The metal could well test 2.9 by May or June. Note Copper correlates positively with Shanghai Equity indices.
WTI Crude:
Crude closed the week at $93.45 after bouncing off its 200 DMA at $89.46. And it closed just under its 50 DMA, which is currently at 94. That would be impressive except that it came with correction in the DXY.
Crude has an overhead resistance at $95 followed by another at $98. Crude could well rally to these levels. However, a failure to take out $98 decisively will confirm that Crude remains in a long-term down trend with a target of $84 for this correction. Note, crude could turn down from $95 itself. Don’t trade oil against the trend – if you can find any!
Shanghai Comp:
Shanghai Comp closed the week at 2278.40 bouncing off its 200 DMA 2236 BUT failing to clear its 50 DMA. The index is correcting for its rally from 1950 to 2446 and the correction is by no means over. Chinese tend to test market extremes multiple times and this correction could well go all the way to 1950. As noted in the earlier posts, there is room in the charts for a new low in the vicinity of 1950 both in terms of time & wave counts.
Expect the 200 DMA to be taken out sometime over the next two weeks.
NIKKEI 225:
NIKKEI closed the week 12,381. Predicting corrections in surging markets like the one in Japan, driven by govt. policy is hazardous business. Nevertheless one must note what the markets are saying. In terms of wave counts, the index is due for a correction, and could well test 11500 as the new support any time over the next two weeks. However, that correction is not likely to last long in time even if it is very sharp in price. Upon testing and holding 11,500, NIKKEI is likely to surge much higher – perhaps 14,000!
S&P 500 [SPX]:
SPX closed the week at 1560.7 and is only 16 points away from its all time high ay 1576. Note, DJIA and RUT have already made new all time highs so expecting the SPX to follow suit is not unreasonable. That said, 1576 is a crucial overhead resistance and a correction before that would be in order.
My sense is that we would see a correction in SPX in the early part of next week that could test its support 1531 although it needn’t go that far. Upon testing & holding 1531 in the ensuing correction, expect SPX to take out its previous top. Else the rally more or less terminates here.
NSE NIFTY:
NIFTY closed the week at 5872.60 turning down from just under its 50 DMA 5940. My sense is that NIFTY is in a minor correction for the rally from 5660 to 5970 that could see it testing 5750 or even 5670 again. Upon testing & holding above 5670, we are likely to see the NIFTY rally towards its previous highs in line with world markets. For the first time, charts indicate that NIFTY is in sync with world markets after all.
Investors should use the buying opportunity for picking up blue chips that have recently completed their corrections from the 2007 peaks.
Apple & NASDAQ:
Following my contrarian tweets in $AAPL a lot of people have asked for a technical view on Apple. As rule I don’t discuss stocks. But my reason for not accepting that the rally in NASDAQ has ended has been based on the logic that bull markets don’t peak with frontline blue chips at correction lows. NASDAQ was and is replete with stocks like INTC, MSFT, IBM, AAPL etc., which have been correcting since April 2012. Blue chips don’t begin to correct 11 months before a rally peaks. Therefore my caution that NASDAQ could pull rabbits out of its hat. Subsequent events have proved my hunch right. IBM, MSFT et al have broken out from lows or are on the verge of doing so and such rallies could well create new highs in these stocks. My contrarian play in AAPL was based on such a logic but not entirely so. I was one of the first to call top in $AAPL at 700 when I tweeted about accumulating inventories at Malls with no customers in them new stores! Those accumulated inventories will take time & discounts to clear.
I would have to show my Apple charts stretching from April 2003 [when Apple used to quote $7 per share!] to demonstrate the textbook “bullish correction” that is now underway. Of course such bullish corrections can be very deep & sharp. Apple’s history shows that when it corrects, it does so furiously. On that reckoning Apple could well be $200 by 2014 before this correction is over. Though my target for the ultimate end of this correction over the next 15 months is a more modest $300. That said, sideways movements in stocks make for great trading plays for traders & that’s what Apple is for the next 15 months as it meanders thru is correction from 700 to 300. Striking 50% [nearly] from the top, isn’t it?
So where does Apple go from here? My sense it goes to $360 before it builds up a base for a bear rally to something close to $500. Can one catch this rally in a manner that makes a decent profit? My sense is that you can’t unless you get exceedingly lucky. My tactic is therefore to buy solid identifiable supports, at specific wave counts, and get out for small profits till you have confirmation that a low has been made.
From a low of $420, the stock can rally to about 460 before it turns down again for significant new low. I would then look to buy some around $360. Would I short at $460? Nope. I have got better things to do with my limited capital.
Happy trading!
MARKET NOTES: Trapped bears can fuel the rally in the US much further
MARKET NOTES: Trapped bears can fuel the rally in the US much further
Topping is a process that takes time, its contours dependent on the exact technical position of bulls and bears and their cash flows. Bulls will push the rally as long as they can distribute while eager bears look for similar opportunities to go short. Setting bear traps is the common tactic to extend rallies at tops because bulls don’t have to use their own cash to fuel such rallies.
Further down in the note, I have briefly laid out the bear traps in the NASDAQ 100 and the Russell 2000 space. The tech sector has a host of stocks [I am an Apple bull with a position picked up in the current meltdown] such as MSFT, IBM, APPL, AMZN, INTC that have been correcting for months and are still at their lows or have just broken away from them. Hence there is fuel for an extension to this rally. Likewise, the midcap space has as usual attracted cash at the top, an unfortunate phenomenon that never changes.
Note this rally is now targeting those critters that turned up their nose at equities and were very bullish on commodities, especially Oil & precious metals thinking a currency debasement that got out of hand was inevitable. This has been one of the most enduring investment themes for the last 4 years and had legions of adherents. Well, the markets are challenging these investors by simultaneously tanking commodities while rallying equities. All this is accompanied by a rising Dollar that used to be negatively correlated to US equities. It’s not an easy time for the doom & gloom crowd, especially those that didn’t watch their cash flow carefully.
It is not my case that the doom & gloom crowd were wrong. Far from it. My case is that their assumptions & conviction are being tested. And those that got too greedy will be slaughtered to fuel this rally.
NB: These notes are just personal musings on the world market trends as a sort of reminder to me on what I thought of them at a particular point in time. They are not predictions and none should rely on them for any investment decisions.
US Dollar [DXY]:
The US Dollar index, DXY, closed the week at 82.72. The index is in a very strong uptrend and is in the process of consolidating around the 82 mark before taking out its next overhead resistance at 83.
Retain my view that DXY is destined to make a higher high than 84.25 before a meaningful correction sets in to this rally. Note the 50 DMA is inching towards a bullish cross over its 200 DMA which is currently at 81.
EURUSD:
EURUSD closed the week at 1.3003. Retain my view that the Euro is correcting for its rally from 1.20 to 1.37 and a 50% correction implies a target of 1.2850 that’s not too far off.
Incidentally, the EURUSD 200 DMA is also currently in the 1.2850 region and we can expect a bounce from there. A more solid floor exists at 1.27 in case 1.2850 is taken out – which is likely.
USDJPY:
USDJPY closed the week at 96.03 piercing through its important overhead resistance at 95. This opens the way for a test of 101 in the near future. There is nothing on the charts to show that the rally in the $ is anywhere near its end in the Yen market. The $ successfully tested its support at 50 DMA at 91 during the week. Expect some consolidation over 95 before the $ rallies rolls on towards 101.
USDINR:
USDINR closed the week at 54.35. $-INR illustrates a classic example of triangulation by markets when they don’t know which way to go. The last rally to 55.13 represented the point D in the triangulation and the $-INR headed for a test of 53.50 which is point E. Expect a rally in the $-INR from the region of 53 to 55 followed by a retest of the all time high of 57.25. Note point E is usually not achieved as markets can rally short of the mark.
Gold:
Gold closed the week at $1578. Gold is nearing its make or break point. If its to test 1525, it must do so over the next week or two or rally from here. Odds are high that 1525 will not hold. Expect a few days of consolidation before make a lunge for $1525. Gold has a tendency to sudden price collapse. The correction from here on may not be very orderly.
Silver:
Silver closed the week at 28.95. Silver has been consolidating just above 28 before it attempts to take out the $26 level. Odds are that the $26 level will not hold and the metal is destined to a deeper support towards $20. Like gold, the plunge could come ant time; in fact as early as next week or two.
HG Copper:
Copper closed the week at 3.5090. Copper has a strong support at 3.40 followed by a deeper one at 3.25. Copper has already violated both its 200 & 50 DMAs. It is unlikely to rally from 3.40 and could plunge much further in line with other commodities. The upward sloping trend line on the chart above is unlikely to hold.
WTI Crude:
WTI crude closed the week at $91.95. Crude has been consolidating just above its 200 DMA at $90. It is the strongest commodity on the charts but the odds of its escaping the general commodity correction are slim if only from the cash flow crunch spill over effect. Crude could however continue to hover above $ 90 but below $95 for a weeks more before it too heads for $84 level.
CRB CCI:
The CRB CCI commodity index closed at 552 after having made a low of 543 and violating its floor at 550. The index is unlikely to have ended it correction and may consolidate for a while above 550 support before attempting a retest of its key support at 450. In terms of wave counts and time, it has plenty of room to get there.
NASDAQ 100: Bear Trap
The chart above best illustrates the bear trap laid for early bears that will now fuel this market rally. Note the large inverted S-H-S on the charts. NASDAQ 100 collapsed on cue at the right shoulder at 2780. However, it turned around from 2690, just above the index’s 200 DMA and negated the right shoulder trapping bears who did not wait for the pattern to confirm. NASDAQ is replete with frontline stocks like IBM, MSFT, AAPL, INTC, AMZN that have been correcting for months and could rally further. Expect short covering to fuel this rally further.
Russell 2000: Bear Trap
Russell 2000 represent another kind of bear trap set for early bears. The index broke support at 895 that it should not have setting off fears that the correction from the top of 932 would broaden into a full-fledged rout. However, the break was not confirmed and the Index has rallied from the “breakdown” point & gone on to make a new. Both Russell 2000 and NASDAQ 100 are par for the course in a topping process as bear traps. Both have given a new lease of life to the rally.
S&P 500 [SPX]:
SPX closed the week at 1551, not far from its all time high of 1576. The real debate is now of how much higher in price & further in time this rally can go. I have mentioned earlier that this rally can extend into May in terms of wave counts. It doesn’t have to. But if there are enough trapped bears, especially those geniuses that were long commodities & short equities, [and there were many such critters who thot no end of themselves] then this rally may well go parabolic from here! Not calling a top!
NSE NIFTY:
Nifty rallied sharply from its support at 5700 to close the week at 5945.70 more or less at its 50 DMA. NIFTY is well above its 200 DMA. NIFTY cannot escape the gyrations in the world equity markets even as it marches to its own rhythm. The real question is how far in price & time can this rally go.
NIFTY is in the process of completing its last leg of correction for the excesses of 2007 and building the base for a new bull market that will probably unfold after 2014 elections. Between now and end of this year, NIFTY has to raise a credible bull flag, a process that is now underway and then correct for the rally from 4540 to 6300 [assuming this rally gets to 6300].
What will be the contour of such a move? My sense it that NIFTY will continue this rally much like that in the US to sometime in May end making a high in the vicinity of 6300 and then correct till the elections of 2014. The correction that follows the May top needn’t be sharp or make a new low. And not all sectors will do it together.
Within this overall picture, expect the NIFTY to decently rally from here on to middle/end May. The strength of the rally from here will tell us something about the next long term bull market to unfold in 2014.
NB: These notes are just personal musings on the world market trends as a sort of reminder to me on what I thought of them at a particular point in time. They are not predictions and none should rely on them for any investment decisions.
MARKET NOTES: Commodities breakdown as the Dollar continues to gather strength
MARKET NOTES: Commodities breakdown as the Dollar continues to gather strength
The week past was really about the onset of deep correction in commodity prices triggered by a strengthening US Dollar. The CRB CCI Index of 17 equal weight commodities broke a long held support at 550 opening the way to a correction that could go all the way to 450.
Meanwhile the Dollar, represented by DXY, continued to gain strength, moving up from 81 to 82.5 over the week. There is no indication that the rally in the Dollar is likely to end soon. Since commodity and other risk asset prices correlate negatively to the value of the Dollar, a breakdown in commodity prices was only expected.
Equity markets in the US, EU and Asia also confirmed the onset of an intermediate correction. It is too early to say what shape the correction will take in each market but it may not be anything like the crash of 2007 as some expect.
Nearer home, the NIFTY had clearly anticipated the correction in US markets even as it followed a rhythm of its own. Barring select sectors like FMCG, Pharma, Pvt banks, most stocks have already seen fairly steep corrections & are close to their lows or have already made them. Long-term investors should ignore the Index and look to buy the lows on the merits of individual stocks.
Stick with the blue chips.
NB: These notes are just personal musings on the world market trends as a sort of reminder to me on what I thought of them at a particular point in time. They are not predictions and none should rely on them for any investment decisions.
US Dollar [DXY]:
DXY closed the week at 82.358 after making a high of 82.58. DXY is clearly in a very strong uptrend as money rotates out of world risk assets back into USTs. Yields on 10 year USTs have dropped from about 205 to 185 basis points. There is no indication that the trend is about to reverse.
DXY could continue to trend up with minor pullbacks to consolidate above 81.50. The next logical target for DXY is 83 followed by the previous top of 84.25. Given the momentum and the wave count, DXY is likely to takeout the previous top of 84.25 over the next 6 to 8 weeks.
EURUSD:
EURUSD closed the week at 1.3020 after making a low of 1.2965. The correction in the Euro from its recent top of 1.37 continues.
The Euro has its first support at its 200 DMA currently placed at 1.2840. Not clear if the correction will stop there. The 200 DMA is followed by another support at 1.27. A 50% correction of the rally from 1.2 to 1.37 makes for a target of 1.2850. So we may expect the correction to violate the 200 DMA but stop in the vicinity of 1.27 to 1.28.
USDJPY:
The USD closed the week at 93.56 after making a 94.76 last week. Wave counts indicate a sideways movement for some time to come but without ruling out a new high above 94.76. An attempt at 101 Yen remains a distinct possibility after some consolidation.
First major support for USD is at 90.
USDINR:
The Dollar closed the week at 54.90 just atop its 200 DMA at 54.65.
INR has a strong negative correlation to DXY and given the strong upward momentum in DXY, USD could head for the previous top of INR 57.25 over the next 6 to 8 weeks.
The $ could consolidate just above its 200 DMA for a few days before testing its overhead resistance 55.50. A break above that level will be a major inflexion point for the $ in the INR market.
Gold:
Gold closed the week $1572 after confirming the $1620 level as the new major overhead resistance. Gold’s next major target on the downside id now $1525.
Gold could pull back from $1560 level to about $1620 level to gather steam for the attempt to take out $1525. It has plenty of time to take out $1525 before mid-May 2013.
Silver:
Silver closed the week at $28.49, just a notch below it 28.50 support.
Silver’s next logical target is $28 followed by the previous low of $26. Given the characteristic low volatility in Silver over last 4 months my guess is that the metal is saving up a major sting in its tail.
I would be very surprised if the floor of $26 holds up for Silver. It could overshoot to $20 very easily & has plenty of time to get there.
HG Copper:
Copper closed the week at 3.501 after making a low of 3.4725. In the process it breached its 200 DMA that lies currently at 3.5580. Not that a breach was required for to confirm a bearish trend in Copper. But the trend in Copper is significant for the trend in industrial stocks.
Copper’s next target is 3.40. The metal has multiple supports between 3.40 and 3.10. Could Copper actually go all the way to 3.10. I think yes if all the risk assets compress at the same time some time mid-May since cash flow shortages spill over asset classes.
WTI Crude:
Crude closed the week at $90.68 after nicking its 200 DMA that currently stands at 90.40.
Crude is now clearly headed into the last leg of its complex correction that started 114.80 in February 2011. That could take crude to as low as $77 before this correction is over.
Next logical target for crude now lies at 89.50 followed by a stronger support at 84. A pullback from the 200 DMA to the 50 DMA would give us a few clue to what follows. Crude will not escape the correction in commodities across the board.
CRB CCI Index:
Having talked about commodities in general, let’s look at the widely followed 17-commodity equal weight index.
The Index broke major floor at 550 to close the week at 544.6. That is a huge breakdown in commodity prices and opens the way to a drop to all the way 450.
The wave counts indicate that barring pullbacks, we might get there by Mid-May.
Russell 2000 [RUT]:
RUT has been the most “frothy” of the US equity indices given the mid-cap space it represents. Corrections here can be brutal. The Index has dropped from a high of 932.85 to 895.84 but the pullback has been pretty weak topping out at 915. On the intra-day charts, an intermediate correction has been triggered whose first target could be 855. Too early to call where this correction will go eventually.
NASDAQ 100:
NASDAQ 100 is actively traded and closed the week at 2748, just below its 50 DMA but still well above its 200 DMA.
The large inverted S-H-S on the weekly charts is ominous although unless confirmed by a breach of the neckline 2500 it really warns of correction with signaling confirmation. Nevertheless it should be noted.
The point here is that NASDAQ100 confirms the onset of a correction. Next target for the index is its 200 DMA at 2678. A test of 2650 however is more significant and may follow in a week or so.
S&P 500 [SPX]:
SPX closed the week at 1518.20. On the intraday charts, SPX has clearly triggered an intermediate correction but it is too early to call what shape it will take. Next target for SPX now becomes 1460. Ot may well get there towards the end of next week.
NSE NIFTY:
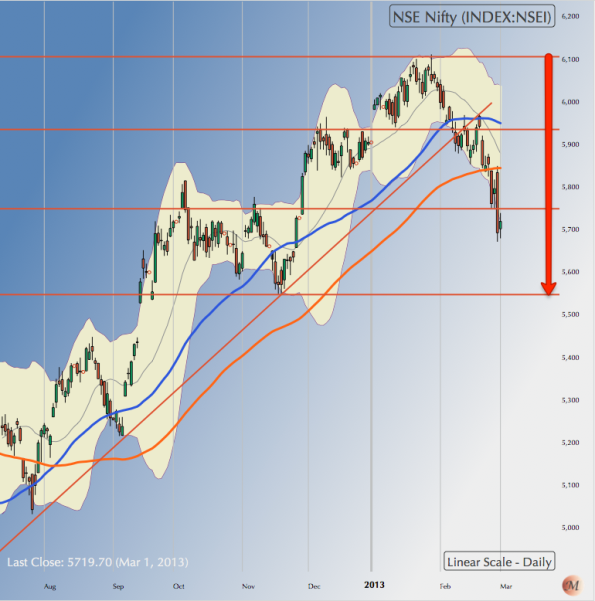
Nifty closed the week at 5719.70 after making a low of 5671.90 during the week. With the breach of 5700, Nifty has opened the way to a drop to 5550, which is also its 200 DMA. Nifty may test this level next week.
Nifty has a more solid support below its 200 DMA at 5350. A dip to that level can’t be ruled out.
Maintain my view that long term investors should look to buy front line blue-chip stocks at their lows in this correction. It is safer to go stock by stock than look at the index which has several moving parts.
NB: These notes are just personal musings on the world market trends as a sort of reminder to me on what I thought of them at a particular point in time. They are not predictions and none should rely on them for any investment decisions.
PS: Regular readers, please RT the blog for others to read.

