Archive
MARKET NOTES: The long rumored Dollar rally in world markets is at hand
MARKET NOTES: The long rumored Dollar rally in world markets is at hand
This blog has long held that we are likely to see a Dollar rally in world markets as QE gets squeezed out of the world monetary system. With DXY breaking atop 82 this week, the Dollar rally is likely on. Dollar being the world’s measuring yardstick, every other asset price will also correct in line with Dollar’s value. We are in for a huge churn in world asset prices across the board. Hard to say how it all fall into place but it will do so over the next 3 to 6 months. Time to be agile with light commitments.
With the Dollar rally on, and equity markets into a correction, one has to see how markets react to prices at first support. Volumes at the critical juncture, both ways, will determine the extent & duration of the ongoing correction. There is little point in speculating until them though the probability of a second deeper leg is a given in Wave IV.
Back in India, the Rupee continued to correct against the Dollar. It bears noting that $EEM, the ETF of choice for all emerging markets, has lead this current bout of correction by many months as the emerging markets were the weakest link in the chain. Correspondingly, emerging market currencies have to some extent anticipated the Dollar rally in world markets. So that fact should cushion the INR even as Dollar rallies from here on against major currencies like the Euro & the Yen. But a Dollar rally beyond 85.50 on the $DXY will be a whole new game.
I would humbly repeat my suggestion to RBI that neither RBI nor GoI has the capacity to raise funds for corporates stuck with unhedged FX loan exposure. Rather than raise false hopes just let these corporates take their writes offs with change in managements were necessary. That is the “creative destruction” of capitalism necessary to clean out & rebalance the system & teach the stupid a sharp lessons. It helps establish deep markets & builds a healthy respect for price signals so vital for a functioning economy. So help clean up rather than bail out. You will do India and the entrepreneurs themselves a lot of good.
Don’t catch falling knives or chase bear rallies no matter how enticing those 8% green blips look. They be mouse traps.
Beware.
Gold:
Gold closed the week at $1394.90. Gold has been in a counter-trend rally since the low of 1179.40 in June this year. I am rather surprised that Gold hasn’t yet rallied to test its 200 DMA which is currently in the $1520 price area. One would have expected the metal to have sufficient bounce to at least get there if not nick it. The metal may still try to test that area in the next week or two. But barring such a “late” rally to $1520, Gold should now correct gently for the rally from 1180 to 1420 and possibly resume its down trend. While the price correction from current levels may be less sharp than before, there is nothing very bullish about the metal barring a dash to the 200 DMA in order to test it. Avoid longs & take profits.
Silver:
On the surface, Silver’s story is similar to that of gold. Having made a low of $18.17, the metal has rallied to a high of $25.12 which is just a wee bit short of $26.2 where the metal’s current 200 DMA is positioned. It may nick the 200 DMA in the next week or two. But Silver clearly hasn’t exhausted its down trend and is due to enter Wave V of it downtrend from its recent high of $49.88. The target of the Wave V when it unfolds would be below $14. I would look to short the metal in the $26 price area if it gets there. Nothing bullish about Silver never mind the chatter about commodities turning up etc.
HG Copper:
Copper closed the week at 3.2240 coming off from the recent high of 3.3885 just under its 200 DMA. Copper is likely to test the top of its previous trading range at 3.20 as the new support over the next week or two. If the support holds, it will validate my wave count that suggests Copper may rally to 4.0 by end of next year. However, if the support is decisively violated then Copper may go the way of Gold and Silver as well. Not taking a position till the metal’s intentions become clearer.
WTI Crude:
WTI crude flared up to a high of $112.24 before falling back to close at $107.70. Crude’s future too hangs in balance and it could go either way from here. My preferred wave count specific to crude calls for an extension to crude’s rally from here to to the $115 to $118 price area before a correction sets in to test $105/108 as the new support for crude. Another view that is still valid is that crude was in a counter-trend rally and has seen its current highs at $112 and is likely to move back to retest $90 price area. My sense is that crude may continue to drift upwards even if other commodities go into the expected correction over the next two weeks. Not bearish on crude although remain very cautious in view of the ambiguity on the charts.
US Dollar [DXY]:
DXY broke atop 82 to close the week at 82.03 confirming my wave count that calls for DXY rally to 85.50 at least; though spread over a period of 8 to 12 weeks. My sense is that DXY may rally to the 83 price area early next week before we see a meaningful correction in the currency. However, the long term trend in the currency should be clear by now. This could be rally that shakes up every other asset price as the QE gets worked over & squeezed out of the world monetary system. This rally won’t be about other currencies. It is about the fundamentals of the world’s currency itself. And the rally may overshoot by a considerable margin.
EURUSD:
For the next couple of months EURUSD will be more about USD that the Euro per se. I expect EURUSD to traverse the full length of its trading range from 1.35 to 1.20 as the DXY rally proceeds. We may see Euro test the 1.20 level by end of September as the Dollar peaks.
EURUSD closed the week at 1.3215 down from its recent high of 1.3452. Barring minor pull backs, expect Euro to head straight for its 200 DMA in the 1.31 price area next week. Upon a failure to hold the line as a support [might take 2/3 attempts] the Euro’s trip to 1.20 will stand more or less confirmed. Again, this isn’t about the Euro; its about the basic value of the Dollar.
USDJPY:
As with the Euro, so with the Yen. Unless BoJ intervenes, which won’t happen until the DXY gets to an extrema in trading range, [Central Banks are getting very smart traders these days & this trend just suits BoJ fine :p] Yen will be driven by DXY. Over the next three months, the Dollar could test 104 Yen or even higher depending on BoJ’s preferred level.
USDJPY closed the week ay 98.16. Barring a reactive pull back to 97, I don’t really see the currency stopping for long on its way to first target at 100.50 Yen to the Dollar. It would be interesting to see how Nikkei responds to the USDJPY developments though initial reaction may be muted.
USDINR:
RBI intervention by opening up a special window for oil importers caused the Dollar to correct sharply from its recent high of 68.80 to close at INR 66.55. With a market vitiated by ad hoc trading disruptions & regulatory restrictions any meaningful analysis of price charts is impossible. So projecting the value of the USDINR become a game of second guessing the RBI. That’s not my aim in this blog.
That said, I had expected the USDINR pair to consolidate from 66 down to about 62 and that might well happen. Over the longer term, assuming trading restrictions come off, I expect the $ to have an upward bias in the INR markets as DXY rallies to 85 or so. Much of the DXY rally to 85 is already in the USDINR price. So don’t expect a 1 to 1 correspondence with the DXY value. On the other hand should DXY overshoot 85.50, [and I think it will,] expect another round of panic by september when the USDINR could shoot well over INR 70. So we are not done yet.
My preferred solution would be for the RBI to close the special window, pass thru crude prices fully, and let all Indian markets correct and clear together by year end so that India can start rebuilding with a fresh slate. The accumulated poison has to be worked out of the system and over-extended corporates should be allowed to fend for themselves including such things as complete change in managements after full write offs. It is the best way forward from the longterm point of view and will also help inculcate a healthy respect for all markets in corporate honchos and business houses. Twenty years after reforms, many still blithely assume their problems & mistakes can be resolved by a wave of Mantri ji’s magic wand that no longer exists. Politicians these days are as much a prisoner of markets as they were once its masters. Learn to respect the market’s price signals. Don’t depend on Govt. fiat. That’s what reforms are all about, no? The one clear message from the carnage in USDINR is that markets are working, that they are mature and rational, and that if left free to operate, they will discipline corporate big-wigs faster than any penal action by government. Three cheers for markets having arrived in India.
Early days to turn bullish on India but the signs are all in the right direction if government/RBI will let markets do their thing and clean up the mess created by stupid business decisions. And of course the huge fiscal deficit.
Nikkei 225:
Hard to see a meaningful correction in Nikkei 225 if the Dollar is heading towards 104 Yen by September end. But correct it must. About 68% of the price correction in Nikkei is already done and the rest should follow in due course. At the minimum, Nikkei must retest the 12500 price area where its 200 DMA also lies currently. Not a time to be shorting Nikkei though. Grab every good buying opportunity to tank up on good long-term exporters from Japan. I think the Japanese markets have bottomed out over the long-term. The bear market from 1989 ended March 2009 and we have just seen Wave I of a new bull markets in Japanese equities. Wave II is in progress and those with deep pockets for the longterm will be looking to buy. Plenty of time though; no rush.
DAX:
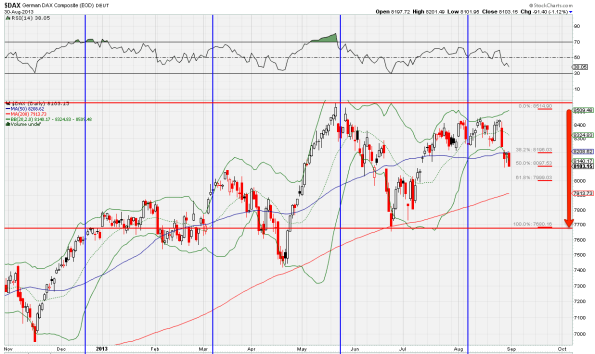
No change in the prognosis for DAX from last week. It is proceeding in the usual German methodical style towards a retest of 7650. I think the 200 DMA on the way, now in the 7900 area, will at best provide a fleeting perch for a couple of trading sessions. To me the 7650 support is the key. We will reexamine if there will be a second leg [or third if you count from 3rd June] to this correction depending on the way the market responds to DAX in the 7650 area. But if my wave count is any guide, this is a Wave IV down from the full bull move up from March 2009 and that means another leg to this correction, albeit a more shallow one, will follow. Don’t buy the dips, not yet any way.
Nasdaq [QQQ]:
No change in $QQQ prognosis from last week. Still think its is headed for a retest of $69 although that may appear a bit stretched given the shallow correction in the Nasdaq so far. However, if you look under the Nasdaq [$QQQ] hood and probe a bit you find tech stocks like IBM, MSFT, GOOG, AAPL et al which are into intermediate corrections from as early as June 2012 [that’s IBM] and these have been in reactive moves up even as Nasdaq as a whole lurched down. The net of the two trends is a shallow correction to begin with but which will accelerate towards the end as the stocks moving up come back into sync. Nasdaq is a very deceptive creature. So no change in the prognosis for the shallow factor. The index will correct to 69 or thereabouts. Will there be a second leg? There should be on but early to tell. The smarter question will be about what to buy in the first leg down when the market gets to 69. More on that in the next two weeks 😉
NYSE Comp [$NYA]:
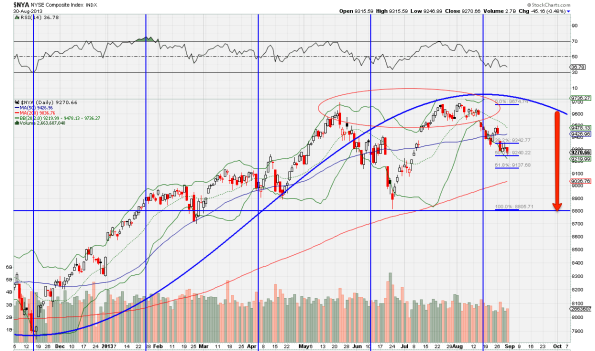
$NYA is my preferred index to check for the gaming of both $QQQ and $SPY. As we can see from the $NYA chart, the index is headed in an orderly fashion to 8820 price area and the 200 DMA lies currently at 9060. The index will in all probability simply knife through the 200 DMA bring a fresh waves of selling from long-term investors. The same holds true for $QQQ and $SPY in turn.
Will reexamine targets once the 200 DMA is taken out. For the nonce, 8820 holds. The 200 DMA has not been under serious threat since August 2011. So a violation of the 200 DMA at so late a stage in the bull market could trigger some very serious selling for money that won’t return to equities. So watch for the market’s reaction to the 200 DMA test here.
S&P 500 [$SPY]:
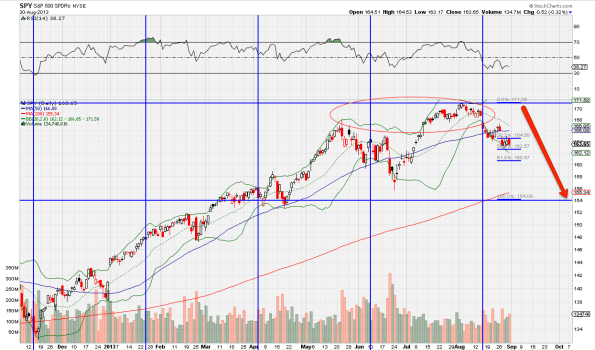
No change in the prognosis for $SPY from last week. The index is on course to test the $155 area as support. Note that in contrast to $NYA, the $SPY 200 DMA is fairly close to first support at $155 and so is unlikely to trigger longterm selling before the index gets to $155. That in itself is a very significant technical point. Note the same holds true for $QQQ whose 200 DMA is also close to first support. Apparently we want a small panic but not too much of it in this correction :p
There may be a second leg to the ongoing correction but we won’t know until we see the market’s reaction to the $SPY in the 155 price area. All I can say is don’t be in a hurry to buy the dips but shorts should take their profits.
NSE NIFTY [$INDY]:
This week I will use $INDY an ETF actively traded on the NYSE and a proxy for the NIFTY. The same weekly chart from the previous week is shown above except that the price levels are in Dollars for the corresponding level of NIFTY.
By taking the INR out of the equation, the pattern on $INDY becomes less camouflaged and more clearer to read. For instance the top of 6198 in June this year is much closer to the top of 6325 in December 2011 than the corresponding points $25.50 and $32.50 on the $INDY charts establishing thereby that we are in bear market that actually stretches all the way from December 2007. It is on this basis that I have been suggesting NIFTY is into a terminating C but with a long tail that could stretch to as low as 4500 before it ends somewhere around January next year.
No change in the prognosis from last week. We will see fairly sharp but short-lived bounces in scrips as short-covering takes hold but fresh buying is unlikely to emerge until a bottom is clearly in place and we know what the contours of the next government will look like.
A three month holiday from the day to day gyrations of NIFTY is a good idea for long-term investors. Others should watch the $INR instead 😉 No, don’t catch falling knives. We are still very early into the correction where defaults by corporates on FX loans outstanding have not yet been triggered. That will come by the 4th quarter or 1st quarter next year.
NB: These notes are just personal musings on the world market trends as a sort of reminder to me on what I thought of them at a particular point in time. They are not predictions and none should rely on them for any investment decisions.


