Archive
MARKET NOTES: WORLD EQUITY MARKETS 19.01.2014
MARKET NOTES: WORLD EQUITY MARKETS 19.01.2014
World Equity markets continue to exude cheer reflecting modest growth in the global economy accompanied by fairly lose and benign monetary conditions. Shanghai is an exception as authorities grapple with the problem of excessive speculation in asset prices financed via the Dollar carry trade. It is not a bubble that lends itself to easy resolution.
Back in India, NIFTY continues to climb a wall of worry as general elections loom, fiscal deficit surges and the current account deficit is barely under control following subdued gold & crude prices. This largely reflects the fact that much of the negativity was already in the price. All said & done, Indian GDP continues to grow at 5% plus rate and a financial bankruptcy on the external account is a still remote event.
Under the hood, there is considerable churn in stock in the US & European markets. Should the interest rate curve start sloping upwards reflecting normal real growth, the financials will stand to make a lot of money and their valuations are pretty cheap given the bad patch they have had since the year 2000. Look for values in this sector for further impetus to S&P 500.
Happy trading.
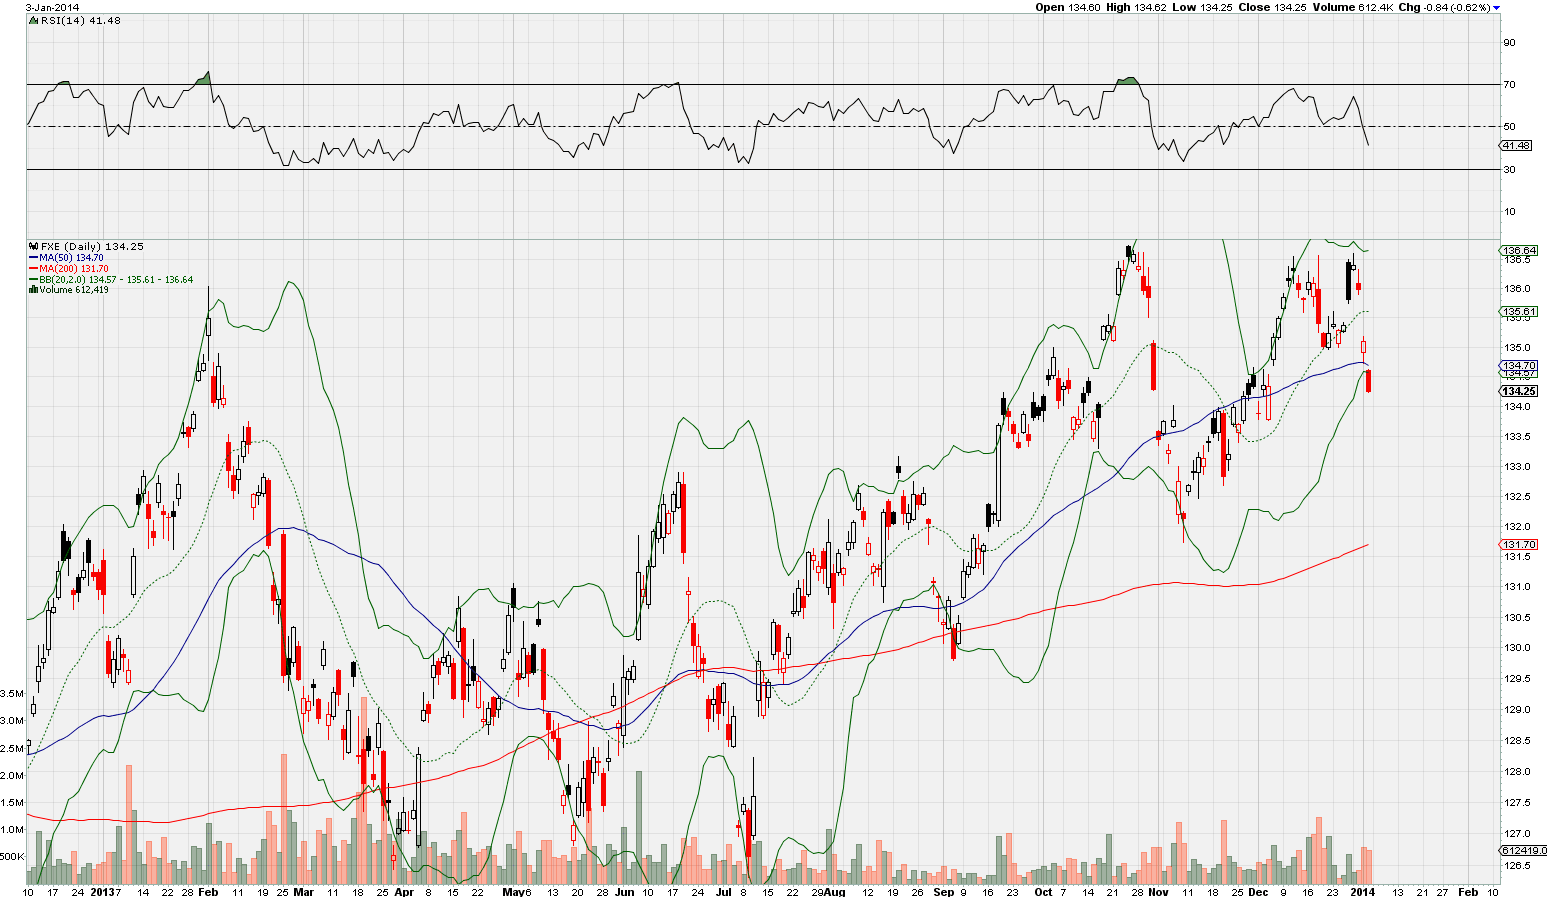
S&P 500:

Some people have asked for analysis focused on the near-term. So presenting the hourly chart in $SPY above.
To my mind, the drop from 184.75 on 31st December to 181.25 on 14th January corrected the run up from 177 to 184.75. $SPY has since rallied to high of 184.85 and is now correcting for that run up. I would be greatly surprised if the bulls yielded the gap just below 183.50 to the bears in this correction. Following the gap there is much more robust support at 183.
I would expect $SPY to resume its rally in the next to 184.25 and beyond. There is really nothing bearish on the charts so on the charts as long as 181 level holds.
Nasdaq 100:

The near term picture for the Nasdaq 100 [$NDX] is similar to that of $SPY.
In my view, the drop from 3591.25 to 3500 corrected the run up from 3430 to 3591.25. $NDX then went on to make a new high of 3610 and is currently correcting for that run up. First support lies at 3580, which held up on first test on 17th January. More support exists at 3570 followed by that at 3540.
My sense is that the gap between 3580 and 3590 will not be filled here and the index is likely to rally sharply to new highs beyond 3617. Position traders may like to keep their stops just below 3520.
Nothing remotely bearish on the index as such but under the hood tech stocks are showing some signs of exhaustion. On the other hand financials are likely at the beginning of a fresh surge up. So do take a look at what you hold than just the index.
NIKKEI 225:

Nikkei is in a very strong uptrend with first target of 16,700. I think the Index intends to clear the previous high of 18,260 in the next 12 to 18 months. That said, 16.700 would be a fairly formidable overhead resistance.
Nikkei made a high of 16320.22 on 12/30/2013 and has been correcting since then. Its 50 DMA is currently at 15,368, which should act a support and has been tested successful once. Further support lies at 15150 followed by a more robust floor at 14800. My sense is that 15350 floor is unlikely to be taken out in this correction.
On the other hand I see a high probability that Nikkei may stage a very sharp rally to just under 16,700 and correct from there in a fairly complex move. The next few weeks are for consolidation. But my sense is that consolidation will happen in a higher trading range of 15,800 to 16,700 rather than the current one. Nothing bearish about the Index.
DAX:

$DAX is in a strong uptrend that will see very brief though sharp corrections over the next two weeks. The Index is targeting 10,000 plus before the end of May.
There will be a bit of consolidation before the index makes a bid for 10,000 and my sense is that having seen a sharp running correction from 2nd December to 14th January, the index is more likely to spike up to just under 10,000 early next week and then consolidate a bit above 9700 for a week or two before making another attempt at the target.
Day to day plays isn’t my forte. Simply don’t have access to the kind of data necessary for a proper analysis of the technical play. So take the above with a bit of caution. However, I am pretty much confident that [a] 10,000 will be taken out much before May and [b] it won’t be taken out at first or second attempt.
Position traders should hold with a stop under 9700. There is nothing bearish in the index yet. And all indications are for an early take down of 10,000.
Shanghai Composite:

Among the major world equity markets Shanghai continues to be the most unambiguously bearish. The Shanghai Composite Index appears headed for a retest of its major floor at 1660 by end of May. There may be minor corrections on the way but the direction is clear enough.
The other noteworthy technical event is the generation of a clear sell signal so late in the bear market with the 50 DMA moving well below the 200 DMA. I wonder what the market knows what we don’t. Avoid calling a bottom on this one. Wait for clear capitulation. In the near term the index is clearly oversold and could pause a bit. But the respite won’t last long. Make a buy list but wait for capitulation.
NSE NIFTY:

NSE NIFTY appears to be climbing a wall of worry what with the Indian economy being ringed with huge fundamental problems at the macro level. But then markets have been so hammered in recent years 6 years of a bear market that I for one wouldn’t question the market’s wisdom. This blog is just about technicals and the message from them is one of cheer. The markets are headed up though only they know why!
The NIFTY made a technical low of 5118.85 on 8/28/2014 and in many ways it can be said to have marked the end of the bear market that began with the crash of January 2008.
The NIFTY has been in uptrend since then making a high of 6342.95 on 11/03/2013. It went into a sideways correction since then and to my way of reckoning, the correction to the run up from 8/28/2013 to 11/03/2013 ended 1/08/2014 at the low of 6160.35, making for a fairy shallow correction to the indices.
Since then the Index has rallied to high of 6346.50 and has fallen back a bit from there. The correction is minor and to be expected as the index can be expected to take 3 or 4 attempts to break free to new all time highs. My sense is that we could well see NIFTY at 6600 by the end of May or just before India goes into polls for a new government.
Nothing bearish in the NIFTY as far as technicals go. I would keep a sharp stop loss at 6100.
BSE Small Caps:

The BSE Small Caps Index [BSCI] made a low of 5100 on 8/28/2013 and rallied from there to a high of 6145 on 11/08/2013. It went into a running correction from that point but continued upwards and it is possible that the running correction ended 1/17/2014 although the possibility of another test of the 50 DMA at 6270 in the next 10 days should not be ruled out.
The index’s 50 DMA crossed over above the 200 DMA on 12/03/2013. Currently the Index is at 6476.76, well above the 50 DMA as well as the 200 DMA at 5851.25.
The Index Price ROC is in oversold territory. I expect the index to head for highs beyond the 6750 level. The steepness of the rally is largely owed to the way stocks were hammered on the way down. Having said that, there is nothing bearish on the charts. I would expect a clear breakout of the small cap index above 7700 by May end or before elections.
Stay with liquid stocks when dabbling in small caps.
MARKET NOTES: 18.01.2014. Is it really time to buy commodities? $DXY $INR $GLD
MARKET NOTES: 18.01.2014. Is it really time to buy commodities?
The commodity cycle has been in a downturn from May 2008 and has run through 6 years of a bear market. While that’s not unusually long for commodities, the cycle is nearing its end and prices look attractive in a historical perspective. But it is it time to buy?
I take look below at Gold, Silver, Copper and crude. Broadly, the technical picture is mixed but the probability of significant price drops towards the tail end of the bear market in things like precious metals is high.
As noted earlier, it is USDJPY pair that appears to be driving currency markets. Indications are that USDJPY may take a breather and correct to 100 from it current level of 104 over the next 4 to 6 weeks and that may drive the Dollar lower in other markets as well.
In India, INR has been appreciating against the Dollar ever since the Dollar made a high of 68.68 against the Rupee last year. That correction may now be over and the Dollar could head for INR 64 gain over the next 2 months.
Bulls should avoid calling bottoms although we are getting close to them. Waiting for capitulation in commodity markets is the better route to profits.
Gold:

Gold made a top of $1434 on 8/28/2013 and completed the down move on 12/06/2013 at a low of $1210.15. Since then it has been in a reactive move up, but actually ended up faltering, making lows of $1193 on 12/19/2013 and again $1181.40 on 12/31/2013. These two lows shouldn’t really have been there although it’s not unusual in reactive up-moves. They betray a weakness in the metal even at this late stage in the bearish move counting from the high of September 2011. One expects bounces at this stage of a bear move rather than a breakdown.
My sense is that we are likely to see more weakness in the metal further down the road that tests upward support trend line that stretches all the way from March 2001. New lows below $1180 appear indicated.
The metal is currently positioned at $1251 a notch above its 50 DMA that’s currently hovering in the $1245 area. In the near-term, we might have the metal continue to rally towards $1270 area by the end of this month. The market’s reaction to the price in the $1270 will decide the future course of price moves. A reversal from there will indicate further price breakdowns are in the offing.
A move beyond $1280 probably indicates a different wave count from the one I am using here that could take the metal all the way to $1360 or even $1440. But that appears unlikely given the weakness in price where one expects strength. Long-term, even if the metal rallies to $1440, the bear move down would be far from exhausted. India’s Central Bank can rest easy for a while more. Gold imports won’t pick up in a bearish market.
Silver:

Silver closed the week at $20.26, above its 50 DMA at $19.95 but well below its 200 DMA at $21.40.
The metal’s price moves follow gold though not exactly or with the same wave counts. By my reckoning, Silver’s latest leg down began from a high of 8/28/2013 and ended at $19.13 on 12/02/2013. Since then the metal has tried to rally upwards towards its major resistance of $22.
My sense is that the reactive move upwards will continue towards the 50% retracement level that coincides with a major resistance and the 200 DMA. Even if the 200 DMA gets taken out, I expect the metal to turn down once again and retest $18 before the complete bearish wave from the top of $49.50 in April 2011 exhausts itself. Note Silver broke down from its top in April end 2011 as against gold, which began its decent from September 2011. So expect Silver to lead the way!
HG Copper:

To my way of reckoning, Copper completed its last bearish impulsive move at 3.0420 on 3/30/2013 and has been in a reactive uptrend since then that has quite a way to go yet.
In the current uptrend under way, Copper made a low of 3.1570 on 11/19/2013 and rallied from there to a new high of 3.3740 on 12/24/2013. Its been correcting from there and could move down to 3.25 over the next 2 weeks to retest its 200 DMA as a support. Both the 50 DMA and the 200 DMA are placed close together in the 3.25 area.
On finding support at 3.25 as I expect, the metal could head for new highs beyond 3.45. Copper is not a bearish play and can be bought at a dip to 3.25 or even higher.
WTI Crude:

Crude is capable of a lot of surprises at this sage of the play. So I am gonna stick my neck out for the very short-term only. We will get a better picture of how things resolve in Crude by early April. Expect the market to surprise either way.
In the near-term, I see crude in a downtrend from the top of $112.22 made on 8/28/2013 and this trend ended in a low of $93.37 on 11/05/2013. Crude tried to rally from that point, with a few fumbles, but made it up only to $100.75 before turning down and taking out both its 200 DMA [$99] and 50 DMA [$95.4] to make a new low of $91.24 on 1/09/2014. The move up from there to Friday’s close at $94.37, just under its 50 DMA, is a minor reactive up-move that could exhaust itself in the vicinity of the 50 DMA. In the near-term – till March end – I see crude drifting down to new lows below $90.
Hard to say which way crude will breakout from 87 to 110 range of the last few years. But a break below $90 could be on the cards. And that’s more bullish news for India’s crisis managers back home. Don’t bet on the long side of crude till the end of March.
US Dollar:

I still think $DXY is in a reactive up-move from the low of 79.06 made on 10/25/2013 that has not exhausted itself. The up-move has already retraced 38% and could move up to 50%, which gives it a level of 82. The Index’s 200 DMA lies at 81.50. It will probably be taken out some time next week.
Any sustained move above 82 would invalidate my wave count and this analysis. The downside to the Index is very limited. So position traders should probably avoid large bets either way.
EURUSD:

The Euro made a triple top of sorts at 1.3825 and then turned down to take out its 50 DMA in the 1.36 region to close the week at 1.3539. To my mind the Euro is now in the second leg of its correction from the top of 1.3832 made on 10/25/2013 with a downside target of 1.3300, which happens to be in the vicinity of the pair’s 200 DMA currently at 1.3346.
Barring minor pullbacks, expect the Euro to drift towards a test of its 200 DMA over the next dew weeks. However, the intermediate up-move in the Euro from its low of 1.20 in July 2012 is not yet exhausted and I expect the Euro to turn up again after testing its 200 DMA.
USDJPY:

To my mind, the USDJPY pair has put in an intermediate top 105.44 on 01/02/2014 and has launched into the second leg of the correction for the run up in the pair from the low of 75.79 in October 2011. Note the up-move from 79, which probably targets 110 or higher is not yet exhausted. However the pair appears to be in complex “running correction” ever since it made a top of 102.88 in May last year and the current downtrend can be seen as a second leg of that correction although one must expect it to be much shallower.
With that in view, expect the Dollar to rally from the current level of 104.29 towards 105.50 but not breach the level next 2 or 3 days before turning down to reach for 100, which also happens to the current level of its 200 DMA. The process may take weeks but the trend after a brief test of 105.50 again should be down towards 100. A breach of 104 will confirm the trend. A decisive break above 105.50 will invalidate my analysis.
USDINR:

The Dollar has been in a correction against INR since the top of 68.80 on 8/28/2013. The correction continues but may be nearing a reversal.
The Dollar closed at 61.54 on Friday. The pair has made a bottom at INR 60.83 multiple times and this will likely act as a floor to further moves on the downside. The Dollar’s 50 DMA lies at 62.1 while its 200 DMA is way below at 60.34.
My sense is that the correction in the Dollar from the top of 68.80 got over with the low of 60.83 on 12/09/2013 and the Dollar is coiling up for a rebound to the topside. My analysis would be validated when Dollar bounces off to the topside from the vicinity of 61 in a decisive upturn. In which case I would look to buy the Dollar after the said bounce with a stop-loss just under 60.80 for a intermediate target of 64.
A break below 60.75 would invalidate my analysis. A note of caution, though. The journey to 64 after a bounce from the vicinity of 61 will be neither one-way nor swift. The Dollar is also correcting to the downside against other major currencies and this will mute the moves to the upside to begin with.
MARKET NOTES 12TH January 2014: World Equity Markets
MARKET NOTES 12TH January 2014: World Equity Markets
The US, Europe and Japanese markets ended 2013 at or near all time highs and have been working off the excesses in the first 2 weeks of the new year. All indications are that with end of the current consolidation over the next, the uptrend may resume shortly. Barring Shanghai, there is nothing bearish about most equity markets.
Back home, the broader universe of Indian stocks made new lows or significant lows after the crash to lows in March 2009. In some cases the rallies from these lows have been fairly sharp. It is too early to say if we have seen the “final” bottom to these stocks in August 2013 or if another attempt to test them will be made before or just after elections. For the nonce, the rally from August lows continues and some wave counts that favor suggest that this may extend to Mid-March. Investors should hold with an appropriate stop-loss. It is unlikely that Indian markets will step out of sync with global markets until elections loom.
Early bears fuel parabolic terminal bull-runs! Beware.
S&P 500:

The SPY chart, the traded ETF of S&P 500, is shown above. S&P 500 closed Friday at 1842.37 and appears to be on its way up to retest the previous top at 1850. Incidentally, 1850 happens to be on a very important trend line running up from the low of March 2009, through the top in March 2012, to the top on 31st December. The trend-line used to be a very important support line from March 2009 to August 2011, and has been a formidable resistance since then. Taking out the resistance would be a very rare but important technical event.
The Index’s 50 DMA lies at 1799, while it’s 200 DMA lies way below at 1689. The S&P 500 usually doesn’t stray that far above its 500 DMA. The fact that 1850 lies on a very formidable resistance, from where the Index reacted and the current “stretch” away from the 200 DMA suggests further consolidation. First support lies at 1808, which is pretty close to the 50 DMA, followed by more support at 1765. S&P 500 has usually turned up from the vicinity of it 50 DMA in recent corrections. We are therefore unlikely to see a breach of 1800 in the event of further consolidation.
There is nothing bearish on the charts for the medium term. Barring a drop to 1800 next week, the market should continue to trend up till the middle of May 2014. Dips to 1800 would be a buying opportunity for traders.
NASDAQ 100:

There is nothing bearish about the NASDAQ 100 [$NDX] in the chart shown above. $NDX closed Friday at 3536.08. First support for the Index lies at 3518 followed by more support at its 50 DMA now at 3468. Its 200 DMA is way below at 3151. The Index’s Price ROC oscillator is close to support. Barring a minor consolidation early next week in sympathy with $SPY, the index is headed up. Sharp rallies to the upside are more likely until Mid-May than sharp reactions. It is unwise to play bear in the Index.
DAX:

$DAX like the US Indices is into a major bull move that could last until Mid-May well above 10,000. That said, in the near term, the Index entered into a short-term correction on 30th December from a top of 9594 that may see the Index testing its 50 DMA, which currently lies at 9220. The consolidation itself could take the first few days of next week.
$DAX has a habit of testing its 50 DMA twice before major moves to the upside. The Index’s 14 day RSI is at 59 and heading towards 40. That more or less suggests one more attempt to test the 50 DMA before the rally to Mid-May. Beware if the rally to mid-May goes parabolic.
Shanghai Composite:

Clearly, Shanghai Composite is marching to a dynamic of its own ignoring other world markets.
The Index closed at 2013.3 on last Friday, well below its 50 & 200 DMAs, which are both in the 2125 region with the 50 DMA having generated a sell signal. The Index’s previous bottom lies at 1850 and there is no reason why the Index should stop short of the mark in the current downtrend.
The wave counts from the last major top in February 2013 suggest the Index may well seek levels lower than 1850. The next support below 1850 lies at the October 28th low of 1771.82. That could well be tested.
NSE CNX 500:

The CNX NIFTY, although widely traded, has become rather unrepresentative of the broader Indian market. The NIFTY is touching all time highs while 70% of the stocks listed on the NSE are barely 30 TO 50% above their March 2009 lows. Therefore, to give a better sense of the market, I track the CNX 500 and the NSE Mid-Cap Index that are more representative of the larger universe of Indian stocks.
The NSE CNX500 is an intermediate uptrend from the low of 3535 made on 12/20/2011 and that trend continues. The Index made a top of 4877.65 on 5/20/2013 before going into a correction that saw a low of 4054 on 8/272013. The corrective wave ended 11/03/2013 at 4847 and we are now seeing an effort by the Index to test the previous support for the Index at 4650. There are multiple supports before the Index hits 4650 and it could well halt much before that level.
My sense is that this consolidation of the CNX500 may continue for a few more trading days into the next week before the uptrend resumes. Investors should keep a stop-loss at 4600 & hold unless breached. With the US markets likely to turn up shortly, I am not bearish on the broader Indian market as yet, largely because the larger universe of stocks are at ridiculously low valuations.
NSE MID-CAP INDEX:

A noteworthy feature of the larger universe of NSE stocks is that a large number of them made new lows or significant lows in August 2013, after the crash of January 2008. In relation to these micro & midcaps, the question is if we will see another attempt to test the lows of August 2013 or is a bottom in place?
The second question nagging minds is the general election due in May 2014 and what impact that may have on the Indian markets.
The wave counts for NSE 500 AND the MidCap Index are analogous. The MidCap Index made a low of 6030 on 12/20/2011 and has been in an intermediate uptrend from there. It subsequently made a top of 8768 on 01/08/13 and corrected to a low of 6515 on 8/27/2013. My sense is that unless 7600 on the Index is breached, we may see the current rally from August continuing [with periodic corrections] up until mid-March 2014.
However, not all stocks may be strong enough to attempt a rally right up to mid-March. There will be those that started their correction on 12/31/2013 itself. Given the rallies in US, Europe and Japan, I would continue to hold stocks until stopped out by a breach of 7600.
MARKET NOTES: Commodities likely to turn up. $GLD & $XAD
MARKET NOTES: Commodities likely to turn up. $GLD & $XAD
Commodity markets in general are in the very early stages of recovery but all of them aren’t likely to move in tandem. Below I take look at the CRB Index for 17 commodities, the Aussie Dollar vs. US dollar and the price trends in Gold, Silver, Copper and WTI Crude.
This post should be read together with the earlier post on Global currency markets. A further post on equity markets follows.
CRB Index:

I have shown the weekly chart of $CRB commodity Index to get a good fix of where we stand in the ongoing commodity correction cycle after the great crash in 2008.
My sense is that we have seen the second leg of the correction in commodities commence from 370.88 on 4/29/2011 play out in two halves and end in the bottom on 11/19/2013 at a low of 272.9. Note the low of November 2013 was marginally higher than the low formed in June 2012 at 267.40.
We should therefore now expect the Index to bid higher and try for the region between 325 and 335 over the next 12 to 18 months. The probability of a lurch below 270 is extremely low.
That said, the Index moved to a high of 285.3 from the low 272.9 in November, which to my mind represents the first of many legs of a move to the upside. The sharp sell off from there is simply a correction to the first leg up. The Index closed at 277.12 on Friday showing a retracement of 66% from the top. While not ruling out a 100% retracement my sense is that Index will turn up come Monday and after a short consolidation, keep moving up towards 325. The move up is also corrective. We aren’t done with commodity correction as yet.
Gold:

I had expected Gold to at least try and breach the low of $1179 formed on 6/28/2013. In the event, Gold got close to that level making a low of $1181.40 on 12/31/2013.
Gold closed last Friday at $1238.60. Barring the usual short-term corrections, I don’t think we will see another attempt to take out $1180 in this leg of the correction.
On the other hand, Gold is now set on a corrective move upwards and could move to $1450 to $1500 range by mid-April. The long-term prognosis for the metal continues to be bearish. However, don’t short gold till you see the highs of mid-April.
Silver:

I have been expecting a divergence between Gold & Silver prices but there simply hasn’t been a spectacular one of the sort I thought should happen. There are significant differences in the pattern of correction underway in both metals though.
Silver could show a muted uptrend in prices in sympathy with Gold over the next few weeks & move up to $22-$25 range. However, I continue to expect a price breakdown in Silver by June end 2014. To my mind there is no tradable opportunity in the metal to the upside until we see capitulation below $18.
HG Copper:

Copper remains the most “bullish” of metals in the CRB Index. It made a low of 2.9875 on 6/24/2013 and then tested its 200 DMA repeatedly before making a higher low of 3.1240 on 11/19/2013. Thereafter, the metal took out the top of its 6-month trading ranging range by breaking convincingly atop 3.35, putting up a bullish flag to make a high of 3.4245 on 1/02/2014.
Meanwhile, the metal’s 50 DMA has pierced through its 200 DMA from below in the region of 3.26 well below the current price of 3.35 signaling a golden cross.
My sense is the metal will move up a bit, to perhaps 3.50 or so and do a flattish correction that tests the previous trading range top a few times before breaking away upwards. Position traders could long the metal at dips with a stop-loss a notch below 3.25.
WTI Crude:

WTI Crude has been in a corrective uptrend from the low of $77.50 made on 6/22/2012 to the high of $109.22 made on 8/28/2013. It has been correcting from that high and made a low of $92.30 on 11/27/2013. In the process, Crude generated a sell signal with the 50 DMA piercing through the 200 DMA to the downside at $98.47. Crude rallied from the low of $92.30 to nick the 200 DMA and turned down again from there taking out both the 200 & 50 DMAs in the process. All told that’s a sharply bearish picture but its very sharpness suggests that it might just be the usual bullish correction in an uptrend.
That said, first support for WTI crude lies at $92.30 and I would be surprised to see a significant breach of $92 given that the commodity is already oversold. A more robust support follows at $87. While Crude could bounce along above $92 till mid-March, 2014, I would look to accumulate the lows around $90-92. There isn’t much downside to WTI crude below $92 because it’s pretty much done with its long-term cyclical correction from the top of $147.27 in July 2008.
AUDUSD:

Am unable to show the spectacular textbook bullish run up in the Aussie Dollar vs. US Dollar here. But in many ways the story of $XAD from the low of 0.47730 in April 2001 to high of 1.1080 on 7/27/2011 is the story of the Chinese demand for Aussie commodities. It is therefore interesting to see what $XAD is doing at the moment.
$XAD went into a sharp correction from the level of 1.108 and is currently placed at 0.8943, showing a retracement of 34% from the bottom to the top. My sense is we could see a retracement to 0.80, which is top of the previous long term trading range for the $XAD from 1985 to 2007.
The other interesting thing about the $XAD is the timing. According to one wave count, the earliest end to $XAD’s correction would be around mid-March and if so, the target could be 0.85. By another count, which I favor, the correction in $XAD could extend to early 2015 and the target could be 0.80. The latter scenario points to delayed recovery in the Chinese economy. In either case $XAD would give early clues to renewed Chinese buying in commodity markets.
MARKET NOTES: Currencies & US interest rates
The story of currency markets since July 2012 to December 2013 can be explained by the depreciation of the Yen. In the 17-month period from July end 2012 to December end 2013, the Yen depreciated by roughly 55% against the Euro and 35% against the US Dollar. In the same period, the Euro appreciated by about 16% against the US Dollar. Yen weakness rather than anything else has been driving currency markets. This may continue for a while longer as Abenomics plays out fully in Japan & China.
The second thing to note is that 10-year yields on US Treasury notes are about to break above 300 bps and head towards 380 bps over the next 6 months. Some of this may already be priced into the equity markets but we can be sure not all of it is in the price. On the other hand, equity markets may actually view an increase in long-term interest rates as confirmation of growth at least to begin with. The impact of rising interest rates on the US Dollar may also be muted to begin with since other rates too are likely to rise with the exception of Japan.
Back in India, the attention will remain focused on the US Dollar which is likely to weaken modestly against the Euro but strengthen against the Yen over the next few months i.e. till mid-April, 2014. However, the USDINR charts show that the first leg of the correction to the run up to 69 may be over, and the Dollar could move in the next few weeks to test the overhead resistance at 64 albeit gradually. A vault over 64 may take a while though as the second leg of the correction kicks in.
A lot will depend on how the equity markets in the US play out in April/May this year. A correction there, long overdue, could change all the variables in the current equations. I shall have more on that in the second half of the week.
Happy New Year to all.
YIELD ON 10 YEAR TREASURY NOTES:

I have put up the long-term weekly chart of yields on 10 year Treasury Notes [$TNX] in order to show where we are headed in terms of interest rates on US Treasuries. Note the current yield on 10 year Treasuries is exactly 300 bps.
On a weekly basis, the yield has breached the previous top at 295 bps and has fallen back a bit to test it as support. The yield has more robust support at 285 bps. My sense is that after a few days of consolidation, we are likely to see yields move up 320 bps or higher. On the price charts the price of treasuries could fall 118 from the current level of 123.50.
Though significant by itself, as it confirms a long-term upward shift in interest rates, the move may not impact equity and currency markets all that much since it is widely expected. Nevertheless, the market’s reaction to a move above 300 bps in yields would be fraught with interest.
DXY:

The US Dollar is placed in a zone from where it can shoot for $DXY 90 or dive for $DXY 70 with equal range and more or less equal probability. The Index closed at 80.9550 on 01/03/2014 and is one of the most difficult currencies to call at this point.
The Index’s 200 DMA lies above at 81.65 while the 50 DMA lies at 80.52 below. I would be reluctant to call the currency either way until it decisively breaks below 79 or above 82. That said my sense of the long-term trend in the Dollar is that [a] it bottomed out at 71.88 on 4/21/2008 and [b] that it is correcting down in an orderly impulse wave starting from the top of 88.46 made on 06/07/2010.
With that larger picture in mind, a correction is under way from the top of 84.78 made on 07/09/2013 mid-April, 2014. For the near term, $DXY can shoot for 81.68, its 200 DMA but is unlikely to sustain above it. My sense is the Index will nick the average and head down again for a retest of 79 before it makes up its mind on the direction in which to head. I am bearish on $DXY till Mid-April. A word of caution is in order. $DXY can compress going forward or show extreme volatility. Compression would be a bullish indicator, while extreme volatility with a mean of 80 would be bearish. That is best that I can do at this point.
EURUSD:
EURUSD is an uptrend from a low of 1.20 made in August 2012. The uptrend has a target of 1.4250 ending mid-April 2014. The pair’s 200 DMA lies well below the current level of 1.35870 at 1.33. The 50 DMA is currently placed at 1.36, just a bit above Friday’s close. The current correction from the top of 1.3892 made on 12/27/13 in no way threatens the long-term uptrend.
That said, EURUSD is likely to find support at 1.3550 and that support is followed by more robust support at 1.3450, which is unlikely to be breached. I expect EURUSD TO turn up again from 1.3450 or above and head right back up to challenge 1.40 again. 1.40 is an important overhead resistance that may take more than 3 or 4 attempts to take out. But that’s the direction in which EURUSD is headed as soon as the current short correction ends.
USDJPY:

The Dollar has been in a major uptrend against the Yen from a low of 75.6 made on 10/28/2011 and that uptrend has a target of 110 Yen and is intact. The 200 DMA of USDJPY is placed at 99.45 Yen while the 50 DMA is currently at 101.7. Both the averages are well below Friday’s close of the Dollar at 104.82.
USDJPY took out the previous top of 103.70 made on 5/22/2013 in the current rally making a top of 105.440 on 1/02/2014. The current correction is little more than one intended to test the last top as the new support.
With that in view, first support from the current level lies at 103.50 followed by a more robust support at 101.50. My sense is the Dollar might take a breather around 103 for 2 to 3 weeks before heading right back to 105 and above. “Abenomics” is determined to run the full course and it’s probably the right thing to do for Japan at this point.
EURJPY:

As the Euro is strengthening against the US Dollar, and the Yen is weakening against the US Dollar, we take a look at the EURJPY, the price of Euro in Yen, to check if the trends in place bear out the prognosis for the US Dollar.
The Euro has been on uptrend against the Yen since the last week of July 2012 from a level of 94 Yen. It topped out recently at Yen 145.67 in last week of December 2013, showing an appreciation of 55% over 17 months.
During the same period, the US Dollar appreciated against the Yen going from 78 Yen in End July 2012 to 105.25 in December 2013 showing an appreciation of 34.94%.
Meanwhile, the Euro appreciated against the US Dollar during the same 17-month period going from 1.20 to 1.390 showing an appreciation of 15.83%.
Putting it another way, it would appear that it is the deliberate weakening of the Yen that is driving the markets over the last 17 months & not Fed actions such as they are. Policy action in Yen explains most of the moves in both Euro & the US Dollar. A word of caution is due though. The 110 Yen to the US Dollar is a formidable overhead resistance and the wave counts favor a consolidation over the weeks ahead. But such consolidation is likely to be well above 100 Yen to the US Dollar.
USDINR:

After topping at INR 68.80 on 8/28/2013, the Dollar has been correcting and has twice successfully bounced off the bottom at INR 61. I think the correction was completed at a low of INR 60.83 on 12/09/2013 and since then the Dollar is an uptrend with a target of INR 64.
Within the uptrend to INR 64, my sense is that Dollar completed wave [a] at INR 62.48 and wave [b] at INR 61.71 and on topping 62.50 over the next few days, will head for 64 or slightly higher.
Over a longer-term horizon, I think the long-term uptrend in the USDINR remains firmly in place. The pair’s 200 DMA lies well below at INR 60 while, the 50 DMA is at 62.12 and the Dollar closed Friday at INR 62.18, just a touch above the 50 DMA.
The Dollar may well turn down in world currency markets, especially against currencies such as the Euro and Yuan. But as far as the USDINR market is concerned, it is decidedly in a long-term uptrend. Don’t shade the Dollar using INR.
It would be a disaster if Shri Modi becomes the PM, says the PM
The Prime Minister in his presser categorically & forcefully made two points with regard to Shri Modi.
Firstly, that it would be a disaster if Shri Modi were to become the PM.
Secondly that Shri Modi presided over a massacre in the streets of Ahmedabad in 2002.
These were not remarks made lightly. Through out his presser, the PM chose his words carefully, and was most animated when responding to the question on Modi. As such, the PM’s assertion that Shri Modi presided over a massacre in Ahmedabad must be taken in all seriousness.
Serious questions hang over Shri Modi’s candidature as BJP’s nominee for the PM’s post. Here is an incumbent Prime Minister who took office in 2004, about 2 years after the 2002 riots, and one who had every reason to familiarize himself with the circumstances surrounding those riots. His remarks thus assume special significance; more so since he feels electing Shri Modi would be a disaster. He has every obligation, as the incumbent PM, to prevent such a disaster and not preside over one himself.
The State should have prosecuted Shri Modi. Instead, private citizens like the widowed Smt. Zalkia Jafri pursued cases against Shri Modi. That in itself was a monumental failure of the State. Worse, the Gujarat government took every opportunity to obstruct justice and destroy evidence as reported in the press. There is a widespread perception that Shri Modi was able to use the lengthy, torturous criminal justice procedures to frustrate prosecution.
We now have a statement from the Prime Minster himself, no less, that in substance supports Zaklia Jafri’s plea that Shri Modi was complicit in conniving at the massacre that took her husband’s life. Under the circumstances, it would be in the fitness of things for Zakia Jafri to request the PM to stand witness in the Supreme Court, where she has the right to appeal, and reveal the basis for the assertion he made in his presser today.
Furthermore, the SC itself has gone to considerable length to assist Smt Zakia Jafri in having her husband’s murder investigated into. Would it not be befitting if the Court were take suo moto notice of the PM’s assertion and invite him to explain himself in the court?
Shri Modi’s election is of great importance to the future of this country. Shri Modi stands accused of a serious misdemeanor by the Prime Minister himself. Would he not like to clear his name before he bids for the highest executive post in the land? Would we not like that he so clear the miasma of doubt & suspicion that still dogs him?
Eminent lawyers should volunteer to help Smt Zakia Jafri draft her appeal to the Supreme Court and request the Prime Minister to stand witness to his statement so that justice is not only done but also seen to be done.
This is perhaps one way our system can redeem itself in the eyes of citizens who have reason to believe that the powerful are able to escape justice or frustrate it to the point of exhaustion.
