Archive
1984 and 2002: Restoring Trust
1984 and 2002: Restoring Trust
1984 was a despicable pogrom. From what I know, in the wake of Indira Gandhi’s assassination, a horrendous act by itself, Congress leaders organized Hindu mobs to extract retribution, in Delhi and elsewhere, from innocent Sikhs who had nothing to do with the assassination. A brute Hindu majority brutalized and killed thousands of innocent Sikhs at random. The pogrom established the principle that it was okay to kill Sikh A, B, & C for the crimes of X, Y & Z.
Worse, in the following elections, Congress used a series of advertisements to project the notion that, were it not for Rajiv Gandhi’s leadership, Sikh terrorists would have prevailed. Rajiv Gandhi won the elections with a near 2/3rds majority in the Lok Sabha. Hate mongering, justified or not, had delivered solid electoral dividends. You can win elections by pandering to the majority by persecuting the minority, a lesson that was not lost on the BJP.
2002 happened in the glare of TV cameras but the script was the same. Following Godhra, a horrendous act of insane violence by itself, large Hindu mobs were organized through out Gujarat, this time by the Sangh parivar, with active connivance of the Gujarat Government. The idea was to teach the Muslims, a small minority, a lesson not written into the Constitution. It was okay to kill Muslims A, B & C for the crimes of X, Y & Z. Muslims were Muslims first, Indians second and individuals last. Collective punishment might violate the Constitutional but, hey, what are lynch mobs for?
Following the pogrom, elections were held to the State assembly, and there again the vast Hindu majority elected a party that had actively organized the pogrom. Hatred had worked again. Hate mongering, backed by a show of brutal violence, paid rich electoral dividends. Nobody bothered with the message the Hindu majority was sending to the nation’s minorities. Or may be it was? That the minorities don’t count?
Who made up the killing & rampaging mobs in 1984? Hindus. 2002? Hindus. Does it matter if they were responding to BJP or Congress calls? Who were the victims? A small minority, the Sikhs in 1984. A larger, but still a minority, Muslims in 2002. It does seem Hindus may kill the minorities with impunity whenever it suits the electoral needs of our political masters. There is a short cut to power. It is politely called polarization. But we know the true meaning.
That’s not all. The State, the major political parties, BJP and Congress, and our evolving discourse now see citizens, not as individuals with inalienable fundamental rights, but as a nameless, identity-less “member” of an amorphous group centered around religion, caste, gender or whatever. We are all Hindus, Muslims, Sikhs or Christians first, and Indians second. We are on the slippery slope to being split into quarreling groups based on whatever identity that politicians find convenient to confer on us. We have lost our first names. Only the last one matters.
The State failed to punish the guilty organizers of the pogroms in 1984 and again in 2002. Cases drag on and on. Evidence has been destroyed, witnesses have been tampered with, some even murdered on morning walks. There is little possibility of bringing them to justice now. So there are advocates that we move on. Can we?
A democracy evolves from a body politic that has learned the virtue of rule of law for everybody; with no exemptions. Democracy as way of aggregating & actuating the political will of people in fact becomes possible only after rule of law has been established. Violation of the rule of law not only negates democracy but also destroys it. 1984 & 2002 are dangerous for our democracy because they provide a shortcut to power to unscrupulous politicians. They can & will be replicated.
Yet, the change in our discourse after 2002 is more worrying than the lapses in implementing rule of law. Post-1984, while the legal process was thwarted in order to protect Congress politicians, there was no effort to justify the pogrom as “necessary” despite the ongoing Sikh militancy in Punjab and elsewhere. The ideal of a secular state retained its primacy as a desirable goal despite obvious flaws in implementation. If anything, the ruling party was contrite about the lapse. In direct contrast, post-202, a veritable army of ideologues has been raised not only to defend 2002 but also to raise the status of its chief proponent to that of a cult God. The change in our discourse is truly frightening for minorities. Worse, the ruling party has miserably failed to restore primacy to secularism in the national discourse. Do top Congress leaders feel handicapped by their own minority status in doing so?
Our evolution as a democracy rests on trust between various individuals & communities. We can be cut and diced along multiple fault lines. Religion is just one the dozens of markers that divide us into different identity groups that can be mobilized politically. Today you divide us according to religion. Tomorrow it may be caste. Then there is class, region, language, what have you. Our diversity can be used both to unite and divide. But hate is a stronger emotion than trust, although trust prevails in civilized societies ultimately. Hate can be used to divide. Only trust can unite. We need to make trust triumph.
What is trust? No, it is not some wishy-washy inter-faith prayer meeting. Trust is no more, and no less, than the faith that rule of law works equally for everybody and that the State exists to enforce such laws without fear or favor. It is trust in old-fashioned government. Trust is rule of law.
We must restore trust. That’s all there is that we can do to make up for 1984 & 2002. Or for any other organized violence. When the State itself is a party to the violence, as in 1984, & more so in 2002, whom do you trust?
That is the problem before all our minorities, and it is this apprehension that we, the majority community, must address in a concrete fashion.
We must restore rule of law to build & nurture trust and faith in our Indian identity. We must again be Indians first. There can be no exceptions.
MARKET NOTES: Expect the equity markets to retest recent supports.
Markets do not take out important supports or overhead resistances at the first or the second attempt. And when they fail to do so, the recoil to the starting point before making another attempt. We saw this scenario play out across most equity markets be it DAX, SPX, Russell or Nasdaq 100. The rally from supports averted an immediate meltdown but the correction is far from over. In terms of wave counts we can see another retest of the same supports before markets resume their uptrend.
Commodities like Gold, Crude staged sharp countertrend rallies to retest the breakdown points. Such bounces don’t last long and before the end of the last week these commodities were also turning down. The descent will gather momentum and the lows will be retested. There were reports that demand for physical gold was much in evidence. I believe all of those known facts are in the price & investor behavior of buying dips is not a new phenomenon. If the reports are relevant we will see them in the price.
Abenomics however may be running out of steam. There is a looming triple top in the USDJPY pair at 100. Expect sideways movement thereafter. Meanwhile Nikkei is at a price point from where we can expect a sharp correction that cud look like a “crash”. In terms of wave counts, such correction could come last week of May, 1st week of June. Highly unlikely that Nikkei will make it past 14550.
Shanghai Composite meanwhile has been retracing its rally from 1950 to 2450 and is at about the halfway mark at 2175 below both 50 & 200 DMAS. A 100% retracement is likely. Worth noting that Shanghai has started its correction in February this year much before the other markets.
Treacherous markets ahead. Expect elevated volatility.
Gold:

Gold closed the week at $1453.60 after having made a high of 1482.30 during the week. Interesting to note that gold turned down exactly as predicted by the charts from the 1480 level.
Gold can rise all the way to 1550 without signaling the end of the bear market though the probability of 1480 being taken out is slim. On the other hand, both in terms of wave counts & time available, gold should at the very least retest $1300 before beginning a counter trend rally. I don not think we have seen a bottom in gold as yet.
Silver:

Silver closed the week at $23.76 after having made a high of $24.34. Both in terms of time and wave counts, Silver has plenty of space to find a bottom. One is not in yet. I would be surprised if Silver doesn’t take out the $20 level shortly.
HG Copper:

Copper closed the week at 3.1845. I don’t think Copper has ceased to be Dr. Copper. There is fairly sustained downtrend in the Shanghai Composite that confirms we haven’t seen the lows in Copper yet. Expect another attempt to take out the floor at 3.10 fairly shortly.
WTI Crude:

Crude continues to behave rather crudely, following the wave counts but taking out important levels in counter-trend rallies. In this respect it is acting much like gold where buyers are lapping up dips. But then markets have a way of crushing such buy-the-dip investors who only provide fuel for long-term trends.
WTI Crude closed the week at $93, after making a high of 93.87. Crude could find support at its 200 DMA at 91.50 for a few days of more bounce. But eventually, I expect crude to return towards the $84 region.
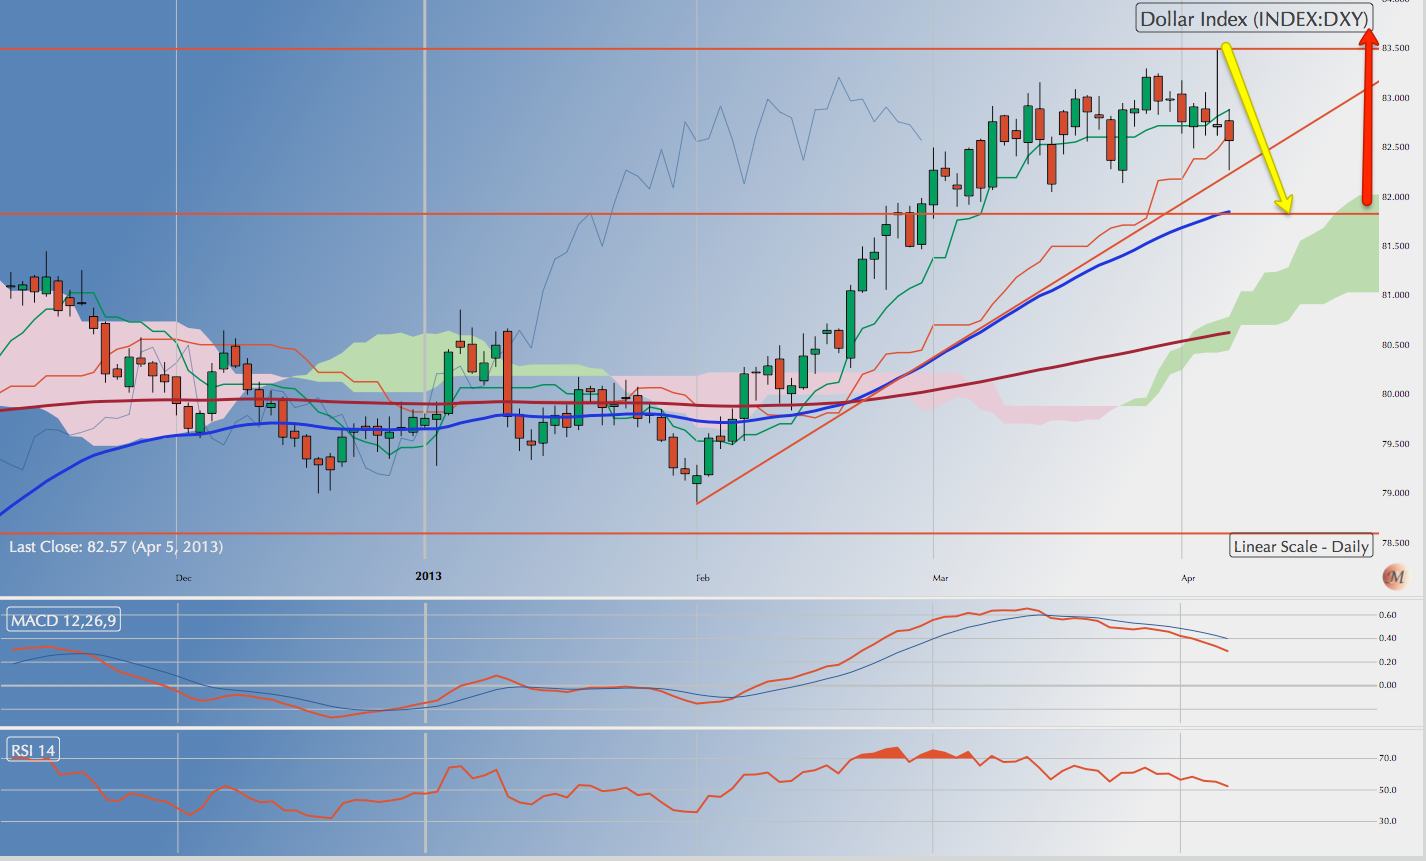
US Dollar:

DXY closed the week at 82.57. DXY is consolidating just above 81.80 for a renewed assault on the overhead resistance at 83.50 followed by 84.25. It could retest 81.80 before making new highs.
EURUSD:

Euro closed the week at 1.3026. The counter-trend rally in the Euro appears over. Barring a bounce off its 200 DMA at 1.2950, expect the Euro to resume its drift towards the 1.27 region.
USDJPY:

Has Abenomics run its course? As shown on the chart above, a double top is in place and a triple top looms for the USDJPY at 100 Yen. From the charts we must expect a reversal from 100, which will confirm on a violation of 96. There is scope for some sideways movement in the currency until September this year. I am neutral on the $Yen at these levels.
USDINR:

Despite the deteriorating fundamentals, there appears to be no dearth of Dollars in the INR markets. Dollar closed the week at 54.37. Expect the Dollar to seek higher levels in the coming weeks where Dollar could drift towards the INR55 mark.
Shanghai Comp:

Shanghai could launch into a counter trend rally from its current level at 2178 to 2250. However, the more likely course is a plunge towards 1950 if 2150 is taken out in the near future. From the wave counts, oscillator charts etc., indications are that we are heading for a “mini-crash” towards 1950 in the next few weeks. Will 1950 hold? Don’t bet on it. This is China.
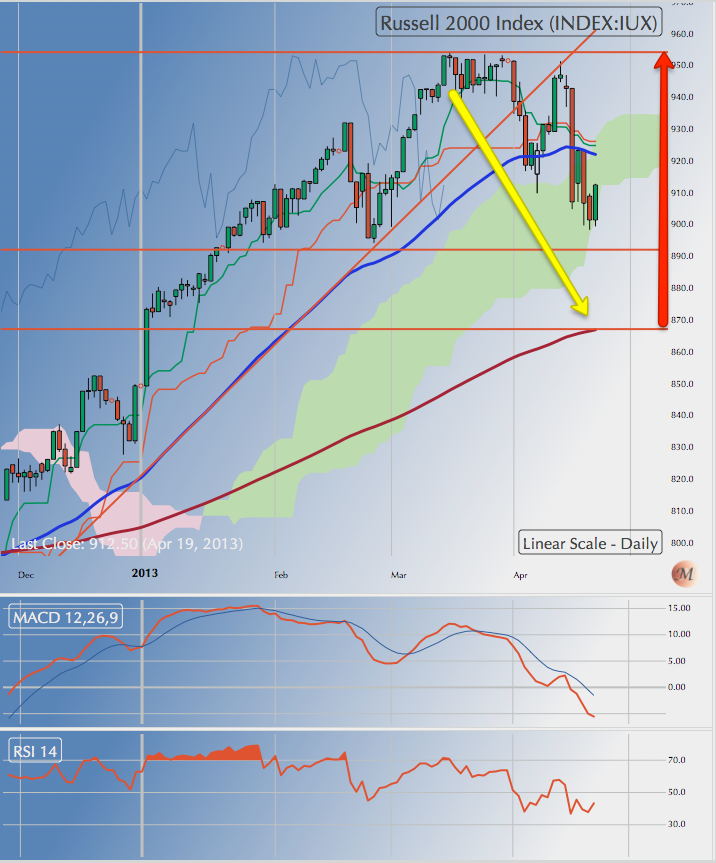
Russell 2000:

Russell 2000 closed the week at 935.25 having rallied up from its support at 895. In my view the correction that began at 954 on 15th March is not yet over and we will see another pull back to 895 levels before the rally resumes and attempts at another new high. A violation of 895 would see Russell plunge to 855 where its 200 DMA rests. The probability of that happening has receded somewhat.
Nasdaq 100:

I have been greatly puzzled by the massive inverted S-H-S on the Nasdaq 100 chart & have wondered how it will resolve. I think it is best to treat the whole pattern as a potential “loose” triple top. More details when I have confirmation. Meanwhile Nasdaq 100 continues in a corrective mode and we can expect it to retest support on its 200 DMA at 2725 in the next week or so. This is not the end of the long-term rally. But we are getting to the beginning of the end.
S&P 500 [SPX]:

SPX, like the other indices, continues in a corrective mode although it started its correction much later than others. SPX could make a new high but the more likely course is a retest of support around 1530. The correction won’t terminate the rally even if we see a plunge down to 1490 that is possible but not probable.
NSE NIFTY:

NIFTY closed the week 5871.45 after making a high of 5924.60 during the week. I do not the think the correction from the recent top of 6110 in the NIFTY is complete. What we saw was a counter-trend rally from 5487 to 5924. With the rally done, barring a small pullback, expect the downtrend to resume towards a retest of 5400. We could see some sideways movement at the higher end of the range as the market readies to take the plunge. The coming dip would be a buying opportunity in a different set of stocks from the last one except banks, which could repeat the last plunge. Wait to buy at your levels.
NB: These notes are just personal musings on the world market trends as a sort of reminder to me on what I thought of them at a particular point in time. They are not predictions and none should rely on them for any investment decisions.
Why Pinkies get the INR wrong
Why Pinkies get the INR wrong
In the normal course of business, talking about Rupee appreciation or depreciation in India is fraught with risk. When does the Rupee appreciate? Our intuitive sense tells us the Rupee appreciates when it value relative to some foreign currency, usually the Dollar, goes up. Conversely, the Rupee depreciates when its value in terms of the Dollar goes down. So far, so good.
Now the Dollar was quoted INR 54 yesterday and is worth INR 55 today. Without reading below, try answering the following two questions. Firstly did the INR rate go up or down? Secondly, did the INR appreciate or depreciate?
Now that you have a sense of the confusion we have created in the Forex markets, let us dig a little bit deeper to see where this confusion comes from and why the Reserve Bank and the financial media, including the venerable pink dailies that perpetuate this silly error, must do something about it.
The genesis of the confusion lies, as for most things naughty, in our socialist past. Back then we pretended INR was the king and everybody wanted to buy it by paying in foreign exchange. So we had a system of “Indirect Quote” wherein the rate quoted was the amount of Dollars one had to pay to a bank to buy INR in exchange. So if the going rate that day was 10, it meant you had to pay $10 to the bank to buy INR 100 in exchange.
Why this roundabout method of quoting a price for the Dollar? Well there are two reasons for it. Firstly, ask the two questions we began with. Let us say the rate was 10 yesterday and is 11 today. Has the INR gone up or down? Yesterday we had to pay $10 to get INR hundred and today we have to pay $11 to buy the same INR 100. Clearly the INR is up in terms of the number, [10 to 11 $s], and rate quoted. Has the INR appreciated or depreciated? Clearly, the INR has appreciated because we have to pay more $ to buy it. So, in the old socialist era, since we bought or sold INR hundred or its multiples, & paid for them in Dollars, our intuition worked fine. If the rate went up, the INR had appreciated and if the rate went down, the INR had depreciated. Further more, quoting for INR 100 made manual calculations a wee bit easier than the rival method of “Direct Quote”.
A system of “Direct quotes” was ushered in by the Reserve Bank at the time of reforms in 1990/91 on the assumption that the market had grown sophisticated enough to understand and use them better 45 years after Independence.
In the Direct Quote system, a fixed unit of foreign currency is quoted in variable units of the home currency. In other words, now when you go to the bank, you are no longer required to pretend that you have gone there to buy or sell INR 100. Instead you ask for a Dollar directly and the bank tells you how many INR you have to pay to get 1 Dollar. Now you are buying and selling Dollars directly from or to your bank.
The system of Direct Quotes treats the Dollar like mangoes, or any other stuff, that you buy or sell for INR. IF mangoes are INR 1000 per dozen, then you expect to pay INR 1000 to get a dozen of them. If the Dollar is INR54 then you have to pay up INR 54 to get a Dollar. If the mangoes are dearer tomorrow, you expect to pay more for them or in other words, the mangoes have appreciated in price. Likewise, if mangoes become cheaper, you expect to pay less in INR or you can say mangoes have depreciated in price.
So what happens when the $-INR rate quoted to you goes up from 54 yesterday to 55 today? Has the INR gone up or down? Has the INR appreciated or depreciated?
Confused again?
Note the question itself is incorrect. We are now dealing in Dollars, which we noted, are no different from Mangoes. If mangoes become dearer or appreciate in price, we don’t ask if the INR has appreciated or depreciated. We talk in terms of the value of mangoes, not INR. Likewise, in the forex market, we should now talk in terms of the value of dollars and not the INR.
Coming back to our two questions, and noting that we are now talking in terms of Dollars, we note the rate has gone up from INR 54 to INR 55. So rates are up. Has the Dollar appreciated? Yes, because we have to pay INR 55 instead of INR54 for it. All work out correctly as our intuition tells us. But only so long as we talk in terms of buying and selling Dollars and its appreciation or depreciation.
What if we insist in terms of quoting direct rates for the Dollar but talking in terms of the value of the INR? Well that’s the prevailing confused system we have in the financial press that needs urgent correction.
We should always stick to talking in terms of the value of the Dollar so that people intuitively know the direction of value of the Dollar from its rate movement. The value of INR moves in the opposite direction to the rates because it is the reciprocal of the rate quoted. That’s a little more difficult to grasp and the cause of much confusion that you see in the financial press which often quote a higher rate and scream INR depreciation!
If the rate you see is higher, it is because the Dollar that has appreciated. If the rate is lower, it is the Dollar that has depreciated. Just like in the case of mangoes, let the INR be constant. It is the price of Dollars or mangoes that goes up or down, not the INR.
It should be that simple.
MARKET NOTES: The claw back in Commodities last week was a dead cat bounce
MARKET NOTES: The claw back in Commodities last week was a dead cat bounce.
Commodities, lead by gold, clawed back some territory in a ferocious bounce but it is unlikely to be anything but a dead cat. Most commodities are on the verge of tipping over into deep long-term bear markets not seen for decades. The dead cat bounce was a second chance to sell.
DAX provides a crucial insight into the state of the equity markets. It launched into a decent correction earlier than most indices and is on the verge of challenging its 200 DMA. The market’s reaction to a nick of its 200 DMA will provide important clues to the future of all markets.
Currency markets are in a flux most being into a transition trapped in the middle of a counter-trend correction to a correction; sort of like the compass at the magnetic pole. But they usually emerge out of such transitions in the same direction as they entered them. I expect DXY to retake market leadership from the Yen.
Emerging markets have lead in this correction and are almost half way through while the US market has yet to begin one. The usual correlations are topsy-turvy. So investors should pick their way through these markets strictly bottoms up, stock by stock.. No time to be chasing the last rally up in US markets either.
Happy trading.
Gold:

Gold closed the week at $1395.60 after making a new low of $1321.50 during the week.
On the charts, gold is grossly oversold and has spent the last two sessions working off the oversold positions. However, in terms of time & wave counts, the price collapse in gold is far from over & may resume shortly.
Gold can correct upwards to as much as $1480 as it works off oversold conditions. But it should resume its fall towards $1260 thereafter. Even $1260 may not be the final bottom for this leg of the fall & there are more legs to come in this bear market in gold.
Silver:

Silver closed the week at $22.96 after making a new low $22 during the week. Silver too is grossly oversold on the charts and is working off the oversold conditions through the proverbial dead cat bounce. It could creep up to $25 in the process but don’t bet on it.
Expect Silver to resume its fall shortly. First support for Silver is far away just below $20. Silver’s fall has been less dramatic than that of gold but the ultimate slump in Silver will be deeper & more extensive. A price of $10 before this bear market finds a bottom cannot be ruled out. The real sell off in Silver is yet to come.
HG Copper:

Copper closed the week at 3.11 after making a low 3.06. Copper has strong support at 3.05 but it would be wrong to assume it will hold. Copper like other commodities could trip into a long-term bear market below $3.
Should it do so, first support lies 2.75 followed by a more robust support at $2.25 which happens to be the metal’s long term support line from 2001 through the December 2009 low. In my opinion, the support at 3.05 could be deceptive.
WTI Crude:

WTI Crude closed the week at $88.01 after making a low of $87.73 during the week.
First support now lies at $84 followed by a more robust support $77. Crude, like other commodities could be preparing for a tip into a long-term bear market. If so, Crude could well slip to $70 in this leg of the fall. First confirmation of this prognosis will come on a break of $84. So while expecting a claw back $91.65, Crude 200 DMA, be prepared for some dramatic falls thereafter.
US Dollar:

DXY bounced smartly from 81.80 as expected and closed the week at 82.84. The correction from the recent top of 83.66 may not be over and DXY could come back to retest 81.80 before resuming the rally towards 84.25. Maintain my bullish call on DXY.
EURUSD:

EURUSD closed the week at 1.3051 after making a double top at 1.32. EURUSD can drift up in a reactive move beyond 1.32 to test 1.33 during the week. Over a longer time horizon, the Euro is in a correction from its recent top at 1.37 and is likely to triangulate in a congestion zone below 1.33 but above the trend line running up from 1.20 through 1.28. Expect confused movement in the currency for the next few weeks.
USDJPY:

USDJPY is headed for a retest of 100 Yen. It has a strong base at 96.70. While 100 may not be taken out even this attempt and we could see a pull back to 96, the eventual target for USDJPY remains 102 and it has plenty of time to get there.
USDINR:

Dollar in the INR Market
USDINR closed the week at 53.93 after making a low of 53.76. Logically, the Dollar should now head for 55.50 over the next few weeks in line with the move up in DXY. This would happen even if the Dollar is to eventually fall back to 52 in the coming months. A break of 53.50 would negate my view.
DAX:

Frankfurt DAX
DAX has lead the correction in the OECD equity markets and now sits right atop an important support at 7400 which happens to be its all important 200 DMA. The index closed the week at 7459.96.
DAX offers a possible preview of what is to follow in the US markets. So a brief review of the factors in play at this point. Firstly DAX is in deep oversold territory & needs to work off the excesses in a corrective up move. Second, with the 200 DMA, any remaining bulls in the market can be expected to defend the point vigorously. Third, 7400 is an important support for bulls by itself given that any fall below it will wipe out all the bull gains from the rally from 7410. Lastly, the intermediate support line rally, running all the way from 5433 meets up with the index at 7250.
So it will be interesting to see how all these factors play out to resolve the index’s direction. On sheer wave counts, my sense is that we will see a nick of the 200 DMA on a closing basis before a decent rally that may or may not make a new high above 8075. Given this, nervous bears covering shorts will add to the fun.
Russell 2000:
US MidCap Space
Russell 2000 [RUT] illustrates a conundrum similar to the one discussed for DAX and is discussed here to show the analogous position in the US markets. [The DJIA, SPX and Nasdaq100 are periodically culled for dead wood and therefore tend to be more robust than the broader market.]
RUT has support 894. Below that lies its 200 DMA at 855-860. And while violation of 894 will trigger some selling it doesn’t challenge the bull markets until 860 is taken out. But if the RUT does get to 860 it will be so oversold that a pullback would be due anyway. In terms of wave counts and time RUT has the range & momentum to get to 860.
The point is, much like DAX, RUT can challenge its 200 DMA and still bounce from there into a rally that could make a higher high than 954. There is time & space for it. So bears will be covering shorts furiously at 860. Not yet time to throw in the towel for bulls. As an investor I would be sitting on substantial cash already & watching the fun from the sidelines! So the above analysis is strictly for compulsive traders.
Nasdaq100:

The Tech World
Nasdaq 100 looks very different from RUT and DAX but closer scrutiny reveals the same basic structure – a not-so-oversold market heading for its 200 DMA with the long-term support line of the rally within striking distance. The index closed the week at 2780 after bouncing off its 200 DMA at 2723. So you know the game well.
My sense is Nasdaq 100 will retest & nick the 200 DMA over the next week or two to test the rallies support line at 2700 before getting terribly oversold. And then, the by now familiar rip back to the top that has been the characteristic of this market will be unleashed. But I would not bet on a new high right now.
SPX:

S &P 500
SPX closed the week at 1555.25 just above its first support at 1530. SPX’s oscillator charts show many divergences and are not yet into deeply oversold territory. Besides note the gradual divergence & transition from DAX to SPX, through RUT & Nasdaq100, where DAX is the weakest & SPX the strongest. The same factors are at play though it doesn’t look like SPX will test its 200 DMA like the other indices. Too early to call an end of the rally in US equity markets me thinks. Note this is not about being bullish. This is merely saying we may not have seen the top yet or have a retest left. Wave counts indicate another a-b-c leg up after the current correction under way that could create a new high.
NSE NIFTY:

Indian NIFTY 50
NSE NIFTY has had a decent pullback rally from the low of 5477 and closed the week at 5688.70 overshooting my target of 5750. Having overshot, the rally can extend to as high as 5850 if it wants to without triggering off a bull move.
My sense is that the correction from the top of 6110 is not yet over and we will have another test of 5450 or the support line running up from the year 2003. In fact the current bull market’s support from 2003 will be tested multiple time before NIFTY resumes a decent rally.
Note not all stock bottom at the same time & our markets rarely give investors a second chance in individual stocks. So stocks that fell in the first leg may not be repeated in the second leg to come. Instead those that held out, like FMCG etc. will be dunked. So keep a ready buy list & buy blue chips at your own prices.
NB: These notes are just personal musings on the world market trends as a sort of reminder to me on what I thought of them at a particular point in time. They are not predictions and none should rely on them for any investment decisions.
Gold price collapse sets up the market for a deep correction in commodities
MARKET NOTES: Gold price collapse sets up the market for a deep correction in commodities.
The big story of the week was gold. This blog has been expecting a price collapse in gold for weeks now. It came with a bang last Friday when gold made a low of $1476 before closing up at $1501. The recovery in price was technical. The correction in gold is far from over. In fact we may launched into a mega-bear market for gold. The next few weeks will tell us how the situation in gold resolves itself.
The best part of the collapse in price of gold [bullish for India on its own merits] was in what it says for commodities in general but for Crude in particular. I am loath to examine fundamentals as this blog is all about technicals. Nevertheless, as I have noted here for a long time, Crude has been a holdout in the general commodity correction despite the well known price pressures from shale, declining US imports & the correction in Copper in China. Hence my sense that Crude is being set up for a price bust on an impressive scale. I expect Crude to test $89 to $84 in the next few weeks but more importantly for crude to signal a mega bear markets that could last years. That’s immensely bullish for an oil importer like India. The price trends in the ensuing weeks should resolve the picture.
Elsewhere, the EU markets continue to correct. So does China. Nearer home NIFTY is on course to test its long-term bull market support trend line since 2003 in the 5300/5400 area. Currency markets were largely placid but are due for some fresh moves. The counter-trend EURUSD rally may have exhausted itself.
The DOW Transports have been making lower tops since the middle of March. It could be a bear trap but is a warning sign that we are approaching a top in the US markets. A collapse in commodity prices, as expected, could give the US equity rally some more steam. On the charts, the extended rally has a few more twists & turns.
Time to be very cautious but opportunities for bears & bulls abound. Can’t complain about lack of tradable volatility!
Gold:

Gold price collapsed dramatically last Friday, closing the week at $1501.40 after making a low of $1476.
With the price collapse below $1525, Gold transitions into a long term bear market unless we see a immediate price reversal over 1550 in the next few days; an unlikely event. The last bear market in Gold lasted 22 years. So it is advisable for long-term investors not to rush to buy and wait for some sort of stability in the market. My sense is that we have not yet seen a bottom to this price collapse.
Near term, one must expect Gold to rally from the vicinity of $1476 to test $1550 level as the new overhead resistance over the next week or two. This retest of the old floor as the new overhead resistance should not be confused with a price recovery.
On the other hand, Gold can drop to $1425 even before it tests the $1550 as the new overhead resistance. Shorts should look for opportunities to cover below $1476.
Silver:

Silver closed the week at $26.33 after making a low of $25.72 and piercing thru its long held floor at $26.
The worst in Silver is yet to come and probably around the corner. Silver has no worthwhile support below $26 all the way $20. The price collapse in Silver won’t be as shocking as that in Gold but just as furious. Don’t bet on $20 support holding in the collapse!
HG Copper:

Copper closed the week at 3.35 after making a high of 3.45 during the week. Copper has led the fall in commodity prices. It spent most of last week testing the old support at 3.45 as the new overhead resistance. My sense is that Copper will test 3.25 in the next few weeks. The correction is far from over.
WTI Crude:

WTI Crude closed the week at $91.29 after making a low of $90.27 on Friday. My sense is that the correction in crude has just begun and has a long way to go down. First support lies at $89 followed by a more robust support at $84. Crude closed below its 200 DMA at 91.50. I expect the 89 floor to give way next week & the decent to 84 may not halt at $84 but go all the way $77.
This is a God-sent opportunity for India to push through a complete restructuring of India Oil Sector eliminating all controls. Let us hope politicians grab the opportunity. The decline in Crude prices may last for years! But that can be confirmed only after we see market’s reaction to Crude in the $80 area.
US Dollar:

The US Dollar closed the week at 82.46 after making a low of 82.22. The Dollar is on course to test support around 81.80, also its 50 DMA before resuming its rally to 84.25. Long term, I continue to be bullish on the Dollar for a target above 84.25 in the coming month or two.
EURUSD:

EURUSD closed the week at 1.3111 after making a high of 1.3180. Euro has been in a counter-trend rally from the recent low of 1.2750 with a target of 1.315, which is also its 50 DMA. The Euro can test 1.315 early next week but is more likely to head back towards 1.27 albeit at a more gradual pace than the last time. Levels around 1.32 are a good place to sell the Euro for position traders.
USDJPY:

$Yen closed the week at 98.38 after making a high of 99.94 during the week. $Yen is pulling back to support at 96.75 before resuming its assault on the 100 level. Maintain my target of 102 for this rally on the USDJPY.
USDINR:

USDINR closed the week at 54.51 after making a high of 54.88 early part of the week. The $ could test support at 53 to 53.50 during the early part of next week before resuming its rally towards INR 55.
Long term I remain bullish on the $ which is clearly coiling up for a decisive move one way or the other. I favor the move up. If you are Dollar bull, a strict stop loss at 53.50 may be advisable.
DOW Transports:

DOW Transports [$TRAN] tracks the goods transportation sector in the US and is often used to track the markets along the DOW according to the DOWV theory. $TRAN is not entirely reliable but often flashed early warning signals for the main Index.
$TRAN went into a decline from the double top of 6291.74 19th March and made a low of 5882 on 5th April. On a rally from there it made a high of 6215.90 which id the third lower low from the double top in March. Unless the $TRAN makes a new high early next week, the Index is clearly signaling an intermediate correction in divergence with the DOW.
Be warned.
Nasdaq 100:

Nasdaq 100 made a high of 2863.66 during the week and pulled back from to support 2832. The Index has support at 2805, which also is its 20 DMA. Nasdaq 100 clearly intends to test its overhead resistance at 2877, which is the Head of a large inverted S-H-S pattern. It will not be an easy resistance to take out. Failure to do so will not signal a crash from there as such important resistances get taken out after several attempts. Nevertheless, expect a pause in the rally there.
S&P 500 [SPX]:

SPX closed the week at 1588.85 after making a high of 1598.23 during the week. First support lies at 1570. The divergences on the Price ROC oscillator are getting more and more pronounced and volumes are thinner & thinner. A short correction in the SPX is about due in terms of time. This could test the 1550 support offered by the 50 DMA. But there is no sign of reversal yet & the rally has time to run in terms of extended wave counts. Not a time to be buying into the market though.
NSE NIFTY:

NSE NIFTY continued its decent towards the 5300/5400 area where it meets its long-term trend line running up from 2003 onwards. The fall was accentuated by a price collapse in INFY following poor revenue growth guidance. InfoTech had been a hold out in this correction along with the FMCG sector. Expect the FMCG sector to begin its own correction some time next week.
No change in the prognosis. NIFTY closed the week at 5528.55. It could pull back to 5550 early next week but expect it to test 5400 before the end of next week. I do not think support in the 5400/5300 area will area will be violated & would look to go long there.
NB: These notes are just personal musings on the world market trends as a sort of reminder to me on what I thought of them at a particular point in time. They are not predictions and none should rely on them for any investment decisions.
Should Investment Dollar Inflows be allowed to inflate value of INR in FOREX Markets?
Should Investment Dollar Inflows be allowed to inflate value of INR in FOREX Markets?
RBI has no explicitly stated exchange rate policy.
The reforms of 90/91 started with a one-time much needed 20% devaluation. Since then the official line has been that markets, meaning demand & supply for Dollars, determines the exchange rate. That line is belied by the recent 20% devaluation of the INR effected in July 2011. [See appended USDINR chart.] The reality is that while overall demand & supply is allowed to determine the day-to-day rate, there are periodic behind-the-scenes interventions to effect major realignments once in a while – which usually turn out to be 20% haircut devaluations!
The markets, and exporters & importers, leave alone long-term users of the market such as industry & entrepreneurs, have no clue as to what drives rates. Hence, investment in the economy, particularly in the export sector, is not guided by a clear-cut exchange rate policy. That in turn leads to under-investment in the export sector, leading to persistent supply side constraints on exports even where India has a demonstrable competitive advantage.
It is time therefore for RBI to stop pretending about markets driving exchange rates. It is imperative to ensure that investments in the economy are optimized automatically to eliminate persistent current account deficits. Such myth making does nothing to address the persistent & ever-widening CAD that constraints India’s overall GDP growth.
To understand the problem in its correct perspective, we need to distinguish between two types of flows in the exchange markets.
The major components of the aggregate flows in & out of the exchange market are on the trade account comprising inflows of Dollars from exporters & outflows of Dollars by importers. These may be called merchant or trade flows and here India has a huge deficit caused by persistently large imports not offset by export of goods and services. The other is investment flow and these are really the mirror image of trade flows. They are a result of having to borrow, or sell the family silver, to finance our imports and need to be carefully distinguished from trade flows.
The imbalance in trade flows is the problem to focus on. It has got to be corrected because in the long run such deficits need to be financed by borrowings or selling the family silver to foreigners. The capacity to borrow and sell the family silver has its own limits. The fact is, 65 years after recognizing the problem; we have just not invested enough in the export sector to achieve a balance in the trade flows.
We need to explode the myth that we can’t export enough. Exports are a function of price. If that’s not so, let us not pretend to believe in markets and their efficacy in resource allocation. We have huge competitive advantages in labor-intensive agriculture, industries like textiles, leather, engineering goods, and services like software exports. There are ever emerging new opportunities like engineering & medical services. What is lacking is not the opportunity for exports but the will to invest in it by creating a supportive, long-term, empowering policy environment.
In passing one may not that the hidden bias in policy has always favored transfer of profits from agriculture to industry. This is not obvious unless you see it in the context of cash crops like cotton. To favor “development” of local industry, policy tried to keep cotton prices below international rates to give the textile industry cheap raw material. Cotton prices were controlled but not textile prices. Exports of cotton & imports of textiles were banned. Did we get a vibrant textile industry as result? No, actually this hidden subsidy to industry killed it by encouraging rent seeking. Similar policy biases against exports where we have a clear competitive advantage abound and persist even after liberalization. Don’t blame the industry for maximizing its profits. That’s what they are supposed to do, never mind the sagging exports. It’s our job to get the policy right, not theirs.
We let wholly extraneous farmers-versus-industry subsidy issues on cotton, or labor related issues in modernizing the textile industry, kill the industry itself rather than exploit our competitive advantage in international markets. In one stroke, textiles alone can eliminate our persistent CAD. It is our inability to efficaciously sort out internal policy, stakeholder conflicts, and other similar issues, that constrain exports, not lack of markets. China prospered in textiles. We killed our industry. Both happened in the same period of time!
Therefore the perennial argument that “structural constraints” limit exports needs to be killed once for all. You cannot keep postponing addressing the real structural constraints because they are structural. 65 years is a long time!
The exchange rate needs to be determined by the real trade flows generated by the trading action of exporters & importers and NOT by overall supply and demand for Dollars. RBI has allowed the distinction between the two to be blurred.
Investment flows are financing decisions to fund the trade deficit. Thus when India borrows to finance the trade deficit, it creates an external liability & uses the borrowed Dollars to pay for the excess of imports. These borrowed Dollars are not the same as earned Dollars. Borrowed Dollars need to be repaid. And there is a limit beyond which nobody will lend these Dollars to us.
However, RBI’s mantra of mixing investment flows with trade flows means the artificial supply of borrowed Dollars get treated as earned Dollars; and goes on to affect the exchange rate in the FOREX markets which is totally absurd.
Portfolio inflows are no different from borrowed Dollars.
These are Dollars we get by selling equity in future profits and other assets to foreigners. There is a limit beyond which we cannot sell equity in our businesses to foreigners without giving up control over our own assets. Likewise, these portfolio inflows have to be serviced through dividends & eventual repatriation. The liability on portfolio inflows is not as well defined as on loans. Nevertheless it is very real & usually far higher than on loans since portfolio investors take on higher risk than lenders.
Pretending that aggregate demand-supply drives the exchange rate means our act of selling the family silver and borrowing actually results in an appreciation of the INR, which is simply ridiculous as it compounds the underlying problem. This unintended effect of flawed exchange rate policy is not just theory. We see the impact of portfolio flows day in day out in the forex markets.
The very fact that RBI has to effect periodic hair-cut devaluations of the INR every 10 years or so shows that the markets are failing to correctly price in the persistent trade deficit on their own, necessitating policy intervention by RBI. One reason for market failure is the mixing of trade related flows with Dollars borrowed abroad and portfolio inflows. There are other reasons for market failure as well and one such is the skewed way RBI corrects the CAD imbalance through policy intervention.
Take the USD INR rate from 1997 onwards. What we see is a generally depreciating Rupee viewed over 16 years but this includes three policy interventions by the RBI through haircut devaluations marked on the graphs. Exclude the policy interventions and we have a generally appreciating INR!
The psychological impact of a generally appreciating INR is simply devastating on exporters. For one thing it can be calculated. It varies from 2 to 3% over a 180-day period, generally the time lag between export of goods and inflow of Dollars. This subtracts from the profitability of exports as the exporter gets fewer Rupees than he expected, while his costs were in dearer Rupees.
Haircut devaluation is sudden, one time, and cannot be factored into the profit matrix even if the exporter could somehow capture it. It is something that happens once in 10 years while the loss of profitability due to an ever-appreciating INR is not only real, but also readily apparent.
No wonder exporters are demoralized, importers are happy, & India loses through under-investment in the export sector.
RBI can argue that over the last 23 years, the INR had depreciated considerably but that’s not enough. The daily movement in exchange rates should favor exporters, & not importers, in a visible transparent manner. RBI owes this to exporters.
RBI can easily achieve this by distinguishing investment inflows from merchant flows. The relevant data regarding portfolio flows is reported to RBI/SEBI on a daily basis. It should be easy for RBI to set its daily buying rate for Dollars such that the Dollar appreciates against the INR at some steady rate justified by the underlying merchant flows, ignoring the investment flows.
RBI can set its sell rate for Dollars wider to avoid getting hit on both sides & let the market plays its role in balancing demand & supply. Over a year or so, the markets will get used to the new structure & learn to discount RBI rates in advance obviating frequent intervention. This will also effectively let the exchange rate reflect trade flows on a continuous basis obviating disruptive hair cut devaluations.
RBI’s act of setting a daily buying rate doesn’t mean taking away from the market. It is a onetime structural reform that makes the market grow to be more efficient. It is not a return the old administered system. It is merely a remedy for an unintended anomaly created in the market by faulty policy.
Over and above the segregation of trade related cash flows from flows generated borrowings or portfolio investments, RBI needs to incorporate other elements of a national strategy for exports in its explicit exchange rate policy. I hope to revert to them in subsequent articles.

MARKET NOTES: US markets in a short term correction but no sign of reversal
MARKET NOTES: US markets in a short term correction but no sign of reversal
Just as one thought a much-awaited correction in the markets was at hand, Bank of Japan unleashed a massive $1.14 Trillion stimulus package designed to clobber the Yen to revive the Japanese economy. Despite that, barring a day or two of turmoil in the currencies, the markets took the whole thing in their stride. Or may be Central Bankers have taken to reading the charts & timing their moves. At least in the case of BoJ, that appeared to be so. Astute timing!
National equity markets are out of sync, each going its own way. Nikkei perked up in response to the package, Shanghai continued its correction, as did India. DAX is leading the EU equity markets into an intermediate correction, while the US, as the strongest economy to emerge from the 2007 crisis, continues to advance.
Nevertheless, signs abound of money flowing out of commodities and equities into US Treasuries indicating we are nearing a top even in the US markets. Commodity prices are compressing even in things like crude, which has been a prominent holdout so far. Crude could tank to levels not seen since 2003 but it is too early for that prognosis. Compressing commodity prices might help world GDP to recover later in the year helping build a base for the next rally & cutting down the deflationary surpluses that have been building in the OPEC countries. High oil prices, in a sense, are nothing but a tax on oil consumers beyond a point.
Indian equity markets continue to correct. My sense we are approaching the end of a very complex cycle of correction that began with the crash of 2007. We might see the correction terminate on the support line that runs up with the NIFTY from 2003 onwards, which in my view would be in the fitness of things. That means this correction ends near about 5400.
Happy trading.
Gold:

Gold made a low of 1539.40 during the week before pulling back sharply to 1581.80 on Friday. It closed the week at 1575.90.
While the pull-back from 1539.40 was sharp, & the low made was fairly close to the target of 1525, my sense is that both in terms of price & time, we have not yet seen a bottom to gold. We can expect at least one more attempt, if not more, to retest 1525 in over the next few weeks or so. My first target for the gold on the downside remains 1525.
A pullback above $1620 would negate this analysis and indicate that a bottom has been made at $1539.40.
Silver:

Silver made a low of 26.575 during the week before pulling up modestly to close the week at 27.22.
Like Gold, the correction is Silver is by no means over, both in terms of price and time. Silver can see a pullback to $28 before it makes another attempt to take out $26. Important supports are usually taken out in the 3rd or 4th attempt. I am not sanguine that $26 floor for Silver will hold.
A sustained rally above $28 will negate the above analysis.
HG Copper:

HG Copper closed the week at 3.344 after making a low of 3.3515 during the week. On the oscillator charts, Copper is clearly oversold & the oscillators have hit a bottom consistently at about current levels. A pullback in Copper is about due.
However, there is time for Copper to retest 3.25, which appears to be its target for this correction. There doesn’t appear to be substantial downside to Copper from current levels even though a bottom may not be in place. Copper’s 200 DMA is currently at 3.50 as is its 50 DMA.
Shorts in the metal should take their profits. Wait to go long until there is a clear reversal.
WTI Crude:

Crude closed the week 92.70 below its 50 DMA currently placed 94.75 but above its 200 DMA currently at 91.15. Crude has first support at 89.50, which is also the base trend line for this rally.
My sense is that the pull-back from the low of 77 in July 2012 to 98/99 level in crude have been reactive in nature and crude is now headed down towards a retest of 77. It may not get there. First target for this correction is 89 followed by 84.
A rally above 95 in crude will negate this analysis. Incidentally, crude has been the odd-man-out in the current commodity correction. That might be about to change.
US Dollar [DXY]:
Currency markets were thrown in turmoil by the $1.14 Trillion stimulus package announced by Bank of Japan during the week. Yet the resilience of the trends underway was such that the news was absorbed without a basic change in direction of the markets in any major currency.
DXY closed the week at 82.603 after making a high of 83.66, a new high for the current rally. DXY could move sideways for a week or two consolidating above 81.50. Maintain my view that DXY is an intermediate uptrend that will test its recent high of 84.25 & possibly reach higher.
A fall below the 200 DMA, currently at 81 will negate this analysis.
EURUSD:

EURUSD closed the week at 1.2989 after making a low of 1.2745 during the week. With that, the first leg of the correction in the Euro from its recent top of 1.37 may have been completed and we could see a period of consolidation in the Euro between 1.27 and 1.32.
Expect the EURUSD to pullback from 1.30 to retest the new floor at 1.27 before drifting back up to 1.32. The pullback is just “B” wave of a correction down from 1.37 and therefore will be choppy.
A violation of the floor at 1.27 will negate this analysis.
USDJPY:

USDJPY closed the week at 97.52 after making a low of 92.52 during the week. A modest pullback from 98 levels in the pair can be expected next week but the target for this rally appears to be 102. Note we are now in the 28th month of this rally from a low of 75.50 to 97.50. There are a few more weeks to this rally but an intermediate correction approaches. Using the Yen as the carry currency is fraught with risk until we have seen a substantial correction in the pair.
A drop below 90 in the pair would warrant a fresh look into the charts. Tread with caution. The BoJ move appears to have been “timed” to extend the rally and the “extension” will depend on heavy intervention.
INRUSD:


This week I have used the INR/USD chart instead of the usual USDINR chart to illustrate an interesting divergence. For perspective, the USDINR is also given above.
The INR/USD chart shows that the Rupee was worth $0.023 in July 2011 and has since depreciated to $0.018. The lower tops from July 2011 to date make the depreciating trend of the INR clear.
The INR made a low of $0.017 approx [Or a $ was worth INR 58.82] in June 2012, [when we say the $ topped out at INR 57.25 in Indian markets] and has since been correcting upwards. The pullback made lower tops consistently but the bottoms were not new lows as often happens in the terminal part of correction. It is as if the INR was building up pressure to take out $0.17 level again.
Reverting back to the usual USD/INR chart, the $ closed the week at INR 54.79, well above its 50 and 200 DMA. The $ could pull back to its 200 DMA at 54.50 early next week and then head testing 55.50 which is a major overhead resistance. My sense is that the USD/INR pair will eventually retest 57.25.
Russell 2000 [RUT]:

Russell 2000 [RUT], which represents the mid-cap space in the US equity markets, was the earliest to make an all time new high well above its 2007 peak of 854. It made 954 on 15th March 2013 and has been correcting since. It closed the week at 932.28. The question is: Has the index topped out in terms of price, wave counts and time?
Taking this rally from the level of 600 in October 2012, it is clear that we are pretty much close to the end but not quite there. In terms of price, unless the level of 850 is clearly violated, there is no signal for a trend reversal. And from current levels first support is 894.
Taking the rally from 776 on 16th November, the index was due to correct by the end of February and has done so from 14th March. The current correction can carry on for a week or more and safely extend to 895 without triggering any technical damage. So all told, it is premature to call an end to the rally although as noted, we are at just about the last stage of this bull market.
Nasdaq 100:

Nasdaq 100 [N100] closed the week at 2771.75 after making a high of 2808.72 during the week. The Index’s monstrous inverted S-H-S looms large over the market but is nowhere near confirmation. And as long as it doesn’t confirm, it doesn’t count, only cautions.
That said, N100 is the “weakest” index in the US equity markets and so it’s worth concentrating on this index for the earliest sign of a breakdown or reversal. The Index’s 200 DMA is currently at 2700. It has already made a lower top at 2808 compared with the one at 2861. It has violated its 50 DMA, which is currently at 2780. And the index’s first major support also lies at 2700, pretty much on its 200 DMA.
Clearly a violation of 2700 triggers a reversal signal that can’t be ignored. On the other hand, a bounce from 2700 will have to take out 2832 in order not to trigger a reversal signal. Hence Nasdaq 100 is probably the best index to watch for confirmation of a reversal. Note, one hasn’t been triggered yet.
SPX:

SPX closed the week at 1553.28 after making a new high of 1570.25. SPX is the strongest of the major US equity indices and apart from the divergences noted in green arrows on the charts, shows no sign of exhaustion.
First support lies at 1530, followed by a more solid support at 1485. Until 1485 is taken out, there is no danger to the continuation of the rally. Indeed, the index could continue correcting for a ¾ weeks and test 1485 without ending the bull market. In terms of time, there is scope for a lot of surprises to the upside in this index.
Until 1485 gets taken out in this correction, don’t short the market.
NSE NIFTY:

NIFTY closed the week at 5553.25, well below its 200 DMA after making a high of 5754. The correction from the recent top of 6100 continues. There are some divergences on the oscillator charts to show we may be nearing a bottom but no sign of reversal yet. These are marked in green arrows above.
Clearly the correction is going to test the support line of the markets that has held up in every correction since 2003. Very hard to see the market violating this support line apart from passing nick over a few days. Indications are that the market will test this support line around 5400 on the NIFTY. On the charts, NIFTY has strong support spanning from 5400 to 5300. My sense is that we may expect an end to the current correction around those levels.
I would look to buy blue chips that were close to their lows & have stopped making new lows even as the market continues to correct.
NB: These notes are just personal musings on the world market trends as a sort of reminder to me on what I thought of them at a particular point in time. They are not predictions and none should rely on them for any investment decisions.
