Archive
MARKET NOTES: The world commodity markets continue to slide while Equity markets pause for a breather
The mighty Dollar [DXY] made a convincing new high above 84.25 and then went into a short-term consolidation just above 83. The Euro and Yen rallied against the Dollar in counter-trend rallies that may be brief. The big news was in commodities where the CRB CCI Index of 16 commodities broke through an important floor at 540 opening the way to 500 and possibly 440. Crude, an important hold out against the collapsing commodity prices, may have completed its counter-trend rally at $97.50 and joined the general commodity correction. If so, falling commodity prices would aid recovery in most economies and may support equity prices for another leg up.
There is no ignoring the fact that world equity markets at this point are in unsustainable parabolic trajectories. The question is when, not if, a deep & sharp correction arrives. Investors need to be prepared for quick exit if they are riding the rallies at this late stage. Going by my wave counts, and in terms of time for those counts, mid-August appears to be a likely candidate for the onset of a sharp correction in equity markets. Commodity markets too indicate that they might bottom out mid-August. Could we be headed for a simultaneous bottom in risk assets some time end August? Such an outcome would be a good test of the robustness of the new financial order that Central Banks have created.
NSE NIFTY failed to hold the breakout point from the topside and could slide down to 5800 region before taking another stab at 6300. However a correction from there, synchronized with world equity markets, is possible & probable. The correction could vicious. Hold tight stop losses just under 5800.
A lot of things, including confirmation of a turning point in the interest rate cycle on USTs, are converging to mid-August. Investors should lighten up in rallies. Bears should wait for confirmation that markets have turned. Else they will only fuel this rally as before.
Happy trading.
Gold:

Gold made a low $1336.30 during the week, which was a wee bit higher than the previous low of $1321.50 made on 16th April and closed the week at $1386.60. My sense is that the floor at $1320 will now hold for a few months while gold prices trace out a complex counter-trend correction between the low of $1320 and the overhead resistance at $1550. From current levels, the first leg of the counter-trend correction could see gold rally to $1500 before resuming the downtrend. Gold continues to be bearish for the long-term.
Silver:

As mentioned in my blog last month, my wave counts indicate the immediate bottom in Silver is not yet in place. Silver made a new low of $20.25 [not shown in above chart] on 20th May before closing the week at $$22.496. The new low is close enough to the often-stated floor of $20 but I maintain this floor will not hold for Silver. Charts suggest Silver should bottom close to $14 towards the middle of August. Note the mid-August date. Many charts are converging to that date across markets & asset classes.
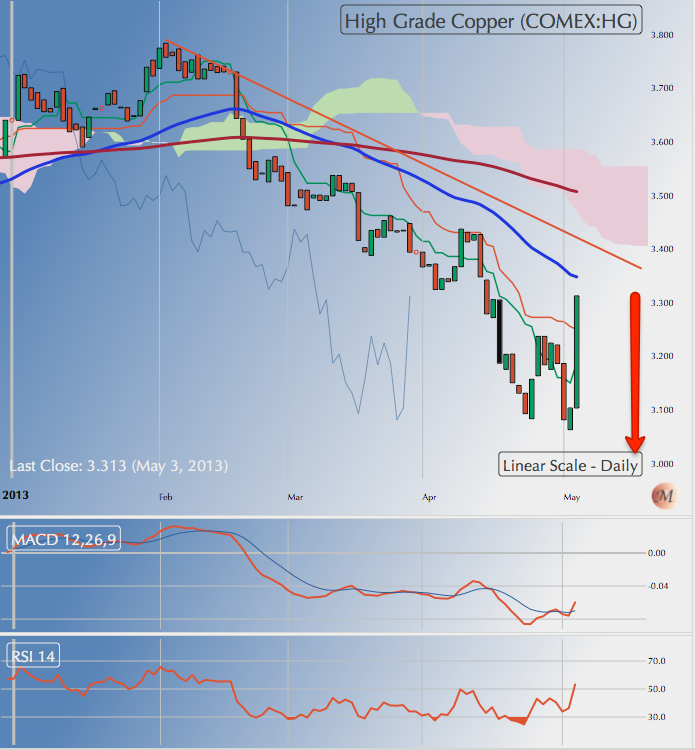
HG Copper:

HG Copper closed the week $3.2955 after making a double top at 3.418 during the week. While Copper can rally to $3.55 in a counter-trend rally, the more likely course is a drift down to 3.00 for a retest of the low on 1st May. There is good chance that the floor of 3.00 may not hold and we could see copper plunge much lower in a synchronized correction towards the middle of August. One can’t be bullish on the metal unless the floor of 3.0 is convincingly retested. Hence the metal is likely to drift lower than upwards.
WTI Crude:

WTI Crude closed the week at $94.15 after making a high of $97.22 during the week. With top at $97.22, the counter-trend rally in crude from $77.28 on 28th June 2012 is over and I expect crude to drift down to $84 over the next 6 to 8 weeks. Crude may find support at $92 for a while which is its 200 DMA. My bearish prognosis will be confirmed on a convincing break of $91. In rallies, crude may not top $97. Again the charts suggest mid-August as a likely day for a new low in WTI Crude.
CRB CCI Index:

As a check on my bearish prognosis on metals & crude here is the chart of the CRB CCI Index of 16 commodities. The index has convincingly pierced the floor at 540. First support now lies at 500, followed by a more robust at 445. My sense is that the floor at 500 is unlikely to hold.
US Dollar Index [DXY]:

DXY made a higher high of 84.5950 during the week and closed Friday at 83.8030. DXY is clearly overbought in the short term and needs to work off the excesses. The consolidation above 83 is likely to continue for a few more weeks. DXY’s ultimate target for this Bull Run now may be as high as 89. The next logical overhead resistance lies at 85.50 and the floor below 83 lies at 81. DXY remain a buy at dips to 83.
EURUSD:

I had expected a more substantial rally in the Euro from the low of 1.2795 but the rally topped off just under the point where the 50 DMA pierced thru the 200 DMA from the topside generating a long term sell signal for the Euro. EURUSD is very interestingly poised in a region that will decide if the pair drifts towards 1.20 or 1.50. My sense is Euro will drift towards 1.3050 in the immediate future before it tells us its final direction. First floor lies at 1.27. A break below 1.27 will likely confirm a plunge towards 1.20 levels mid-August. Once again the mid-August date crops up on the charts! Ominous.
USDJPY:

Clearly, USDJPY was overbought at 103 and needed to consolidate. There is more time to this consolidation and the Dollar could test 100 Yen level from the topside. However, the rally in the pair is unlikely to be over any time soon. Expect a resumption of the Yen’s slide after a week or two of consolidation.
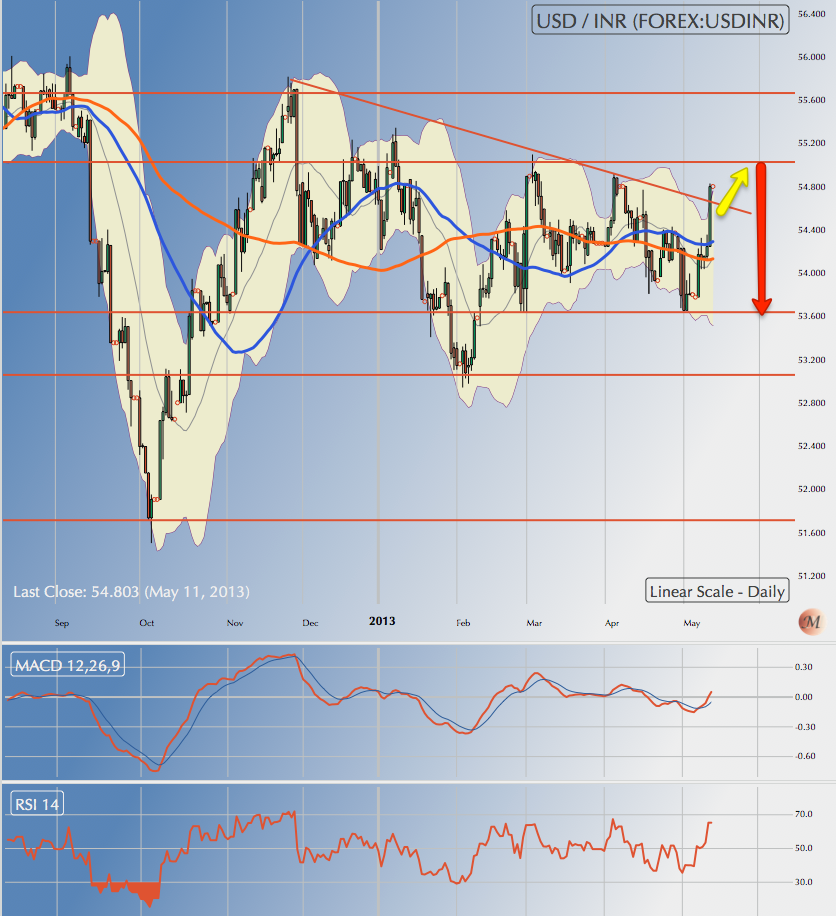
USDINR:

USDINR chart has been generating rather mixed signals of late. But it may have decided on a clearer direction over the last week or so. The Dollar closed the week INR 55.81. Recall a dash for INR 55.50 was expected. The next couple of weeks will be crucial for the future of the USDINR pair. First the Dollar needs to confirm it break above INR 55. A couple of weeks of base building above INR 54.50 to INR 55 will point towards a retest of its last all time high of INR 57.30. On the other hand, a decisive break below INR 54 will indicate an eventual drift to INR 51. I favor the first scenario where Dollar retests INR 57.30.
DAX:

The problem with markets going parabolic, and equity markets have gone parabolic, is that charts become an unreliable guide in the short-term and stop loss points are too far away to be of help in protecting against capital erosion. This holds true for both bulls & bears. That said, the chart above indicates the bull rally is on unless 8100 on the DAX is taken out convincingly. However, wave counts suggest a period of some consolidation ahead above 8100. Note the 50 DMA is at 8000, while the 200 DMA is 7000. So the averages are pretty much useless at this point in telling us when & where this rally could terminate. Wave counts suggest another leg up after current consolidation.
Shanghai Composite:

Shanghai Composite is close to finally terminating its bearish correction from the top of 6124 made in October 2007. How it terminates this correction will be interesting to watch as it plays out over the next few weeks. The Index is on a downtrend from the top at 2445 made in February 2013 but in the middle of a counter-trend rally midway, which may have ended at 2314. The Index should now make a dash for 2240 in short order and perhaps to 2150 after that. Being China don’t rule out 1950, the previous bottom either though my sense is that the present dip will terminate well before that level. Shanghai may well provide the first clue to what’s in store for rest of the equity markets. On the other hand, a rally above 2450 from current levels will signal a bottom is already in place, an unlikely possibility but one that shouldn’t be ruled out completely. Watch this index carefully along with HG Copper.
NASDAQ 100:

No surprises in the NASDAQ 100 chart. The Index went into a correction as expected and it could test 2850 as it continues to consolidate. 2850 is also its 50 DMA. Keep tight stop loss orders just below 2850 and enjoy the ride, which probably has another leg up, but terminating some time mid-August.
S&P 500 [SPX]:

SPX was clearly overbought at 1687 and needed to consolidate which it is doing. The index closed the week at 1649.60. The Index’s correction is likely to be brief and may not reach down as far as 1600 although that is something one would expect if SPX hadn’t gone parabolic. Going by wave counts when is the earliest this rally can terminate assuming it has another leg up? Yes, mid-August again! Looks like all risk assets will tank together which isn’t a bad way to test the robustness of the new financial order that Central Banks have created.
NSE NIFTY:

As expected, NIFTY turned down from the 6200 region to consolidate and test the breakout from the topside. Clearly, the breakout above 6065 has not held and NIFTY closed the week 5936.80. NIFTY’s 50 DMA lies at 5843 while the 200 DMA lies at 5765.85. We can expect NIFTY to take support at 5800 in the immediate future. The market’s reaction to prices in the 5800 region will tell us if the rally is to continue and test 6300. Given my wave counts, I suspect NIFTY will rally to 6300 before correcting in line with other world markets by mid-August. Keep tight stop losses below 5800. A decisive fall below 5800 will negate my analysis.
NB: These notes are just personal musings on the world market trends as a sort of reminder to me on what I thought of them at a particular point in time. They are not predictions and none should rely on them for any investment decisions.
Understanding the Middle Class Angst post 2007 Crash
|
Understanding the Middle Class Angst post 2007 Crash [A 2 year old article published in Sunday Guardian recently]
World stocks have been falling in spite of better-than-expected US jobs data. REUTERS s the world plunges into a long-term bear market that could last another two years or more, it has become obvious that there are no easy or quick fixes to the current set of problems that grip the world economy. The hope that the world’s central bankers could rekindle growth with Keynesian stimulus packages is fading. The debt created by the stimulus packages in the US is too large in relation to the underlying GDP of most developed countries to permit easy refinancing from bond markets. The developed world now faces grim prospects, wherein real cuts in living standards are necessary, at least for a while, before normal growth returns. The burden that this entails needs to be shared optimally and equitably if social tensions are not to explode. So far, little thought has been given to the problem of how these might be shared without impairing future growth prospects or further deepening social fissures. The run-up to the market crash of 2008 was characterized by a banking system that had run amok in terms of credit creation, credit quality and trading little understood credit derivatives. This binge was underpinned by a lax Federal Reserve or FeD, the US Central bank, under Alan Greenspan that believed market could do no wrong and abdicated its regulatory role to the markets themselves. The credit bubble was left to collapse on its own. Therefore, when the collapse came in 2008, it was after credit had run through two decades of uninterrupted expansion. The crash in the markets, particularly bank stocks, laid bare the full extent of the havoc wrought by unrestrained lending. Hundreds of banks failed. More were threatened.
The authorities chose to save the banking system instead of letting the bad ones fail and the rest regroup and consolidate. Much of the so called “Keynesian stimulus” that the Central banks created has gone towards “replacing” impaired bank capital rather than asset and job creation. No wonder then that trillions of dollars poured into banks neither created new jobs nor stimulated growth. Banks have used to the money to replace capital that had been paid out earlier as dividends in good times to distribute unreal paper profits. As the FeD drives interest rates to zero, or even negative, it impacts the wealth and well-being of people profoundly. The reality is that the poor have no savings that the FeD can tap into, and the super-rich escape its regulatory ambit by using hedge funds to park their savings, which in turn follow global returns. The only people with savings that FeD can access through its hold on the banking system is the middle class that uses domestic asset classes to park it savings. The net result of the FeD’s effort to shore up bank capital has resulted in huge wealth transfer from the middle class to banks. Barring a few lucky bondholders, most middle class savings have vanished or diminished beyond repair. The level of pain being inflicted on the middle class invites revolts against the system. That is more obvious in Europe where the banking system took a larger share of the toxic mortgage losses than in the US. What can be done to mitigate middle class pain and ensure more equitable burden sharing that also helps foster growth in the real economy? Warren Buffett has pointed to the way forward by suggesting taxes on the super-rich. It is necessary to understand the particular context of this suggestion before condemning it as a return to the evils of socialism. The super-rich escape hidden levies imposed on savers through an artificially low interest rate regime by parking their funds in hedge funds that get global returns and pay no taxes in the US. More than that, much of the losses incurred by the banking system in trading credit derivatives resulted in huge profits to hedge funds that went short in toxic mortgages. Nothing wrong with that. Trading is a fair, if zero sum game, and if the banks were foolish and hedge funds smart, it is no concern of anybody. But there is a caveat. Had the FeD not bailed out the banks, there is no way by which the hedge funds could have collected on the bank obligations due to them. Their profits, howsoever fairly earned, would have remained paper profits and would have had to be written off as unrecoverable. What I am trying to say is this: but for the FeD bailout for banks in full, there would be no real profits to hedge funds and their super-rich clients. These are the profits that Warren Buffett wants to claw back, not fully but in some measure. Can it be done? As social tensions rise because of the invidious nature of burden sharing, meaningful action becomes less likely. The route taken by UK to adjustments by reducing transfer payments to the have-nots has led to unprecedented rioting in London and elsewhere. Greece, Portugal, Spain, Italy are not finding the money required to fund their deficits and may have to cut back on subsidies.
|
|||
|
he US is better off because of the dollar’s safe haven status. But it too will find social tension spiral upwards. It is society’s goodwill that gives currency to the wealth of the super rich. Charity is one way to recycle some of the profits back to the have-nots. Under normal circumstances that is the preferred way to do things. In extraordinary times like the present, the way suggested by Warren Buffet may be the only viable way to go, albeit for a limited period of two to three years. To us Indians this form of less than fair returns on savings through artificially low interest rates is nothing new. It was standard practice from the 70s to the 90s and was one of the bad habits that the government kicked as part of reforms. Pranab Mukherjee brought it back with a vengeance on his return as Finance Minister. After two years of being relentlessly and stealthily fleeced, the middle class is out on the streets screaming for blood. It may not know why it feels let down, and may be protesting generalised corruption, but in reality it has seen its wealth and options erode considerably in UPA coalition’s second term. That angst may be the underlying discontent that Anna Hazare has tapped into. |
Expect equity markets and Dollar to consolidate gains before rallying further
MARKET NOTES: Expect equity markets and Dollar to consolidate gains before rallying further
The US Dollar was the big story of the week. This is what I wrote in my last blog post on the USD:
“I prefer to view it as Dollar strength because I have been bullish on the Dollar right from May 2011 and to me DXY is just launching into its Wave V that will take it above its previous top of 84.25. But Dollar strength is going to impact commodities further compressing prices while the equity markets may in fact ignore it.”
The DXY made a high of 84.515 during the week. Clearly DXY is overbought and needs to work off overbought conditions. That will trigger consolidation in US equity markets that are just as overbought. And there may be some pressure off commodities as well.
The second big story of the week was the second collapse in gold prices. This is what I said in last week’s post on gold:
“With the price crumbling from 1489, Gold now starts the hunt for bottom that will make a decent stab at taking out $1321, its previous low. “
Gold made a low of $1353.6 during the week and we may still get to $1320. But the bigger story is that we may expect a fairly sharp rally from there after some consolidation.
Do read the post on crude carefully. My sense is that WTI Crude has a lot of nasty surprises in store for unwary bulls in crude.
Happy trading.
Gold:

As expected in last week’s blog, Gold turned down and closed the week at $1364.7 after making a low of $1353.60. Gold would be well supported in the $1320 region. A significant dip below $1320 appears unlikely though it can’t be ruled out entirely. My sense is that over the next two weeks gold would confirm a bottom in the $1320-1360 region and rally sharply from there for a target of $1550. Look to buy gold in this dip as close $1320 as possible. Keep stop loss below $1250.
Silver:

Silver closed the week lower at $22.352 in line with expectations. First support for Silver from current level lies at $20 and the metal has plenty of time & space to get there. My sense is that Silver’s chart is deceptive and may hide a severe sting in its tail. Would be unwise to assume that the $20 support will hold for Silver.
HG Copper:

Copper too turned lower as expected last week and closed the week at $3.323 per lb. The downtrend in Copper $4.65 in February 2011 now appears to be nearing termination & over the next week or two, Copper will likely attempt to confirm that $3.05 is an solid support for this correction. Upon confirmation Copper can be expected to rally from around $3 per lb. for a target of $4 per lb. Look to buy the low with a stop loss under $2.75 per lb.
WTI Crude:

WTI Crude has basically been in a counter-trend rally with a target of $100 from the low of $77.56 in June 2012. That counter-trend rally is now coming to a close and the stage is set for some rather dramatic collapse in crude prices. Crude made a high of $97.17 2 weeks ago, tested its 200 DMA $92 last week and closed the week at $96.02.
My sense is that Crude could pull back to $97 early next week but is likely to fall rather sharply from that level. Could crude collapse as dramatically as gold? It is possible. Over the next 4 to 6 weeks I expect Crude to test $84. I would not rule out $77 either. First support from current levels is $90, which we could see next week. Short with a stop loss just above $100.
US Dollar:

DXY rocketed upwards last week, closing the week at 84.38 after making a high of 84.515. Although I am a Dollar bull, even I did not expect such a dramatic turn around in the Dollar. The market appears to be setting up some vicious bear traps especially where popular sentiment is contrary to logical direction of markets. DXY is clearly overbought and needs to work that off. I would expect a consolidation just over 83 level for a week or two. The ultimate target for this Bull Run in the Dollar could be much higher than my initial target of 84.25.
EURUSD:

The Euro closed the week at 1.2838 below its 50 and 200 DMAs. The fall in EURUSD is over-done though entirely as expected in this blog last week. The Euro has tested support 1.285 along the upward sloping trend line for this rally from 1.20. Over the next week or so we can expect a fairly sharp pullback towards 1.32 levels before the downtrend resumes again.
USDJPY:

The Dollar closed the week Yen 103.18 after making a high of Yen 103.30 during the week. The Dollar is clearly overbought in the Yen market [as elsewhere] and needs to consolidate for a while. Over the next 4 to 6 weeks expect it to retest Yen 100 level before making a dash higher. There isn’t much to trade for though.
USDINR:

The Dollar maintained its elevated levels against the INR during the whole of last week closing the week at 54.88 after making a high of 54.898. While the correction in DXY overseas may keep the Dollar subdued in the INR market, wave counts suggest a rally to 55.50 before it resumes its downtrend. I expect a pullback to INR 55 early next week before the Dollar heads down to INR 53 region.
CRB CCI Index:

There is a tremendous churn going on the commodities market that has bullish & bearish implication for different stock & equity markets in general. The ongoing churn is more of a once in a decade kind of churn and not your garden variety of a correction. Where could commodity markets go? The index is currently at 530. First support is at 500 followed by a more robust support at 445. In other words, a further correction of about 15% looms! It won’t be uniform across commodities but it could be a killer.
NASDAQ100:

Nasdaq100 closed the week at 3028.96, the new rally high. Both oscillators above signal the index is overbought and needs to work off the excessive steam. The Index’s first major support lies at 2937 gap followed by a more robust floor at 2860, which is also the index’s 50 DMA. However, there is nothing on the charts to indicate a trend reversal. Keep stop loss at 2875 and enjoy the ride. There is still time & counts to this rally.
SPX:

SPX is even more overbought that the Nasdaq100 and needs to work off steam. The index closed the week at 1667.47 the new high First major support lies at 1600 although it is hard to see how SPX could possibly get there in a normal correction. Expect a shallow running correction before the uptrend resumes after a week or two. Markets at this late stage in rally can stay overbought for long periods.
NSE NIFTY:

NIFTY closed the week at 6187.30 breaking atop the previous high at 6088.40. NIFTY is overbought and needs to retest this 6088 level as new support in a more robust fashion before heading for the next overhead resistance at 6324. If 6088 holds, it will be the first confirmation of my hypothesis that we are at the start of a new supper-cycle in the NIFTY.
On the other hand, if 6088 doesn’t hold NIFTY can comeback to retest 5800 and possibly 5400 although the latter looks improbable right now.
My sense we will see both – i.e. a lung for 6300, a failure to top it & a correction back to 5800. Could be very volatile times ahead. A dip to 5800 would be welcome though and should be used as a buying opportunity.
NB: These notes are just personal musings on the world market trends as a sort of reminder to me on what I thought of them at a particular point in time. They are not predictions and none should rely on them for any investment decisions.
The US markets continue to make new highs while the NIFTY plods on to first resistance
MARKET NOTES: The US markets continue to make new highs while the NIFTY plods on to first resistance.
You can’t really argue with markets making all time new highs. All you can do is follow humbly looking for the first sign of weakness or a crack and of that there was little on the charts. That said, US & EU equity markets are in the over-bought zone and need to test previous resistances as new supports in the week ahead. So expect a bout of consolidation.
This blog isn’t about fundamentals and so I am not going into the debate about what’s driving the currency markets – Dollar strength or Yen and EURUSD weakness both of which cracked up on Friday. I prefer to view it as Dollar strength because I have been bullish on the Dollar right from May 2011 and to me DXY is just launching into its Wave V that will take it above its previous top of 84.25. But Dollar strength is going to impact commodities further compressing prices while the equity markets may in fact ignore it.
Crude has been the odd man out in the commodities markets where even gold with an army of stale bulls buying the physical metal has given way. In a manner of speaking, Crude has been doing a series of counter-trend rallies, which at no pint threatened $100 let alone get near its previous top. My sense is that these series of counter-trend rallies is coming close and the next serious drop in crude prices may not see the sharp & strong rebounds that have characterized previous drops. Get ready 4 prolonged subdued crude prices.
Gold has yet to find a bottom, & given its tendency to excessive volatility in drops, it is hazardous to try and call a bottom. So wait for a confirmation. For position traders the next bottom would be a decent buying opportunity from a medium term perspective.
NIFTY could consolidate below 6100 for a week or so. Those who missed the bus at 5400 could consider buying their blue chips in the consolidation that ensues.
Happy trading.
Gold:

Gold closed the week $1436.60 after making a low of 1418.50 during the week. With the price crumbling from 1489, Gold now starts the hunt for bottom that will make a decent stab at taking out $1321, its previous low. Given the wild swings in gold prices, & investor attitude towards the metal, a lower price of $1250 can’t be ruled out. The bottom could come around the 4th week of May. Traders should wait for bottom to buy for a modest but tradable rally that will follow in June. The long-term picture doesn’t change. Gold is in a bear market.
Silver:

Silver closed the week at $23.65. Silver’s counter-trend rally, unlike that of gold, has been tepid making a high of $24.79. My sense is that Silver is approaching a point where you could see price simply slide down below $20 by the first week of June if not earlier. Silver is likely to time its moves with gold.
HG Copper:

Copper closed the week at 3.353 just a notch under its 50 DMA after rallying from a recent low of 3.04. My sense is that Copper may have put in a bottom at 3.04. That doesn’t entirely rule out a retest of the same for there is still time for it. We could see Copper retrace some of its gains in a final wave v that could try to retest 3.04 even if it doesn’t go all the way. First overhead resistance lies at 3.45, which will almost certainly cap this rally.
WTI Crude:

WTI Crude closed the week at $96.04 after making a high of $97.1 during the week. The low for Friday was 93.37. Crude has seen a series of sharp counter-trend rallies since the low of $77.69 on 28th June 2012. I believe we are nearing the end of these counter-trend rallies and Crude may be about to enter a more subdued phase of its correction. While not ruling out at another stab at $98, my sense is Crude will drift down towards $84 region before the end of June.
US Dollar:

DXY turned smartly from the low of the week at 81.80 to close the week at 83.23. First support lies at 82.50, which is its 50 DMA. Being overbought, we can expect a few days of consolidation above 82.50. But there is little doubt in my mind that DXY headed for a retest of 84.25 over the next few weeks. In fact the target for this Bull Run, which started at 72.92 in May 2011, could be much higher & that has implications for commodities and stocks!
EURUSD:

The Euro closed the week at 1.2992, more or less at its 50 and 200 DMAs after making a high of 1.32 during the week. That sets in motion the wave C of the Euro’s correction from the top of 1.37, which has already seen a low of 1.27 in wave A. Over the ensuing week we could see the Euro pull back up to the 1.31 region in a reactive move before resuming the decent to 1.27 if not lower. Best not to call a bottom in the Euro.
USDJPY:

The USDJPY pair surprised by taking out the Yen 99 level rather convincingly making me to go back to the drawing board to pick another wave count. The new wave count with make the correction we saw from the beginning of February to end April as a running Wave iv correction and we now into Wave 1 of Wave v. To early to estimate targets before the wave count is confirmed but we could see USDJPY consolidate above 100 for the rest of the week before taking another stab at the overhead resistance at 102. Bullish on the Dollar as you will recall from the commentary on DXY!
USDINR:
Dollar closed the week INR54.80 mirroring the strength in DXY overseas. The Dollar had a target of INR 55.50 In the current counter-trend rally and after a brief consolidation, could drift towards that level. However, the rally in the Dollar may not last long in the INR market. Hard to go into the many factors here but briefly, a surging equity markets attracts Dollar inflows from foreign investors that counter the overseas strength in DXY. And RBI is not very clear headed on where it wants to see the INR.
DAX:

DAX closed the week at 8278.59 after making a new all time high of 8358.23. A consolidation above 8100 during the next week will more or less confirm that DAX has given itself another leg to this Bull Run that can extend up October this year. Enjoy the ride with stop loss just below 8100. There could be doubts about the above prognosis if the DAX cracks 8100 in the ensuing consolidation.
Nasdaq100:

Nasdaq100 closed the week at 2981. It is due for a mild correction that could test first support at 2877, which is also its 20 DMA over the ensuing week. Upon the support holding, there is nothing to suggest that the rally in Nasdaq100 ends at anytime before end of August. Enjoy the ride with stop just under 2850.
S&P 500 [SPX]:

SPX closed the week at 1633.70 after making a new all time high of 1635.01 during the week. The index is due for a bout of consolidation just above 1600 over the next week or so after which we can expect the rally to continue till August end. The rally will only be called into question if first support at 1600 is seriously violated. Until then enjoy the ride with stops just under 1600.
NSE NIFTY:

NIFTY closed the week at just under its first serious overhead resistance at 6110. The NIFTY is definitely overbought and the oscillator charts are signaling a correction that could see NIFTY test its 50 DMA at 5800 or even its 200 DMA at 5700. Nevertheless such a correction, while sharp, would be brief and my sense is that NIFTY could well see much higher levels before we see a meaningful correction. Meanwhile I continue with my wave count that suggests we are the at the beginning of a new super-cycle as mentioned last week.
NB: These notes are just personal musings on the world market trends as a sort of reminder to me on what I thought of them at a particular point in time. They are not predictions and none should rely on them for any investment decisions.
MARKET NOTES: S&P 500 makes a new high while NIFTY begins a new Super cycle.
ECB delivered a rate cut on Friday that saw the DAX rally to make new high on the rebound from its 200 DMA. With that new high, DAX signaled it might still have some steam left in it. The US markets were quick to follow suite. Russell 200, Nasdaq100 and S&P500 all made new highs and indicated that they may have another leg to their respective rallies.
The rate cut saw commodities rally in reflex. However, the mighty Dollar indicated it might have completed its correction and is ready to resume its rally. The commodity markets may not have completed their correction just as yet. Cheaper commodities could lend strength to equity markets going forward.
NIFTY may have ended its correction for the 2007 bull market at 5477.20 on 10th April. If my analysis is correct, with that low, NIFTY could have begun a new super-cycle, which could run to 2025. It promises to be a very volatile one. Confirmation will only come with a new high on the NIFTY & that could take months.
Those who didn’t buy the lows as I advocated should buy this rally on consolidation above 6100. There is no need to chase stocks. The market abounds with blue chips that have just completed their multi-year corrections. I prefer to buy these, rather than stocks in fancy, because with good managements & strong balance sheets, these blue chips capture any uptick in the economy much before others. And offer far higher risk adjusted returns than others when bought at cyclical lows.
Avoid the crowded trade.
Gold:

Gold closed the week at $1467 just under its overhead resistance in the $1480-1490 region. The metal has spent most of the last two weeks working off the oversold conditions caused by the crash in price from 1550 to 1320. The metal may continue to consolidate just below 1490 for a while more before moving down to retest the $1320 floor. Note a move to $1550, though unlikely, is possible without signaling the end of the long-term bearish trend in gold.
Silver:

Silver closed the week at $24.07. Like Gold, Silver has spent the last 2 weeks working off oversold conditions. Expect Silver to resume its downtrend and move towards $20 in the next 2 to 3 weeks.
HG Copper:
Copper closed the week at 3.3145. With the second successful test of 3.04 during the week, Copper may have completed the current leg of its correction. After a short consolidation below its overhead resistance of 3.3, it could move up to test its 200 DMA at 3.50.
WTI Crude:

Crude closed the week $95.61. Crude’s volatility is simply unbelievable. It has been moving from one extreme of its trading range to the other at the drop of a hat. To my mind, extreme volatility like the one we are seeing in crude, implies a change in long-term trend that is widely disbelieved in the market. The idea of peak oil still has much appeal. Nevertheless, the wave counts & major trends suggest, that crude remains bearish. Over the next week however, crude retest its overhead resistance at $98 and hover there for a while before moving lower.
US Dollar:

DXY closed the week at 82.195 after making a low of 81.52 during the week. With the retest of floor at 81.80 the correction in DXY is over and we can expect the move towards 83.50 to unfold shortly. Maintain my view that the long-term bullish trend in DXY will see it retest 84.25 by end of July.
EURUSD:

EURUSD closed the week at 1.3111 after retesting its recent top at 1.32. In terms of wave counts the counter-trend rally from 1.2780 to 1.3242 may be over. The pair’s 50 DMA is just a wee bit above its 200 DMA that will trigger a sell signal. Maintain my view that EURUSD will maintain its bearish journey to the 1.27 region over the next 2 months.
USDJPY:

USDJPY closed the week at 99.02 after making a low of 97 during the week. In terms of wave counts, the currency may be heading for a triple-top at just under 100. Unless the pair makes a new high soon, the bull run the pair will have run out of Abe’s fuel.
USDINR:

The Dollar closed the week at INR 53.8 after having made a low of 53.63 during the week. The Dollar can test INR 53 floor over the next few days before heading up towards INR 55 in a counter-trend rally. Expect a largely sideways movement of the Dollar in the Rupee market to persist for a few months more.
DAX:

DAX made a new high of 8130.16 during the week closing at 8122.29. Note the current rally comes off the index’s 200 DMA from the 7400 region, which was reached after a 5-part impulse wave down! In the short, DAX attracts more support on a reactive move up [short-covering] than on an impulse wave down. DAX may now have extended its rally much like the US markets by another leg. Expect DAX to consolidate above 8100 before moving up. A drop below 7850 negates this view.
Russell 2000:

Russell 2000 pulled off a feat similar to that of the DAX. The only surprise was that the bounce came from 895 instead of the 200 DMA at 855. Note the breakout above 954 needs confirmation. If confirmed, the US midcap space can now extend its rally to mid July. Watch for consolidation above 894. Stop loss should now be just below 890.
NASDAQ100:

Nasdaq100 resolved the massive inverted SHS on its weekly charts by the most emphatic method known – making a new high with a huge gap up. Pity the bears! The index closed the week at 2944.59. Upon consolidation above 2877, the index gives itself a new leg to the rally that can extend into the first week of August. Stop loss is now 2800.
S&P500:

SPX closed the week at 1614.42 after making a new high of 1618.46. The index surprised by bouncing from 1530 instead of testing 1490. If the new high is confirmed as a breakout on testing 1598 from the topside, SPX’s rally can now extend to mid-August. The target could be as high as 1700. Stop loss now should be 1530.
NSE NIFTY:

The final correction in the NIFTY for the excesses of 2007 may have ended at the low of 5477.20 on 10th April. That means we are now into a new super-cycle for the NIFTY and it will span 8-10 years and may well be more tumultuous than any we have seen before. For the next week, expect a break above 6100 before a bit of consolidation above that level which will confirm the beginning of a new bullish rally.
As I have stressed before, Indian markets don’t usually give investors a second chance at either buying or selling in individual stocks. This is one of those rare occasions when the index itself has raced away before reconfirming a bottom. A retest will come of course. But that may be months away. Those who haven’t bought the lows in individual stocks should look to dips to buy.
NB: These notes are just personal musings on the world market trends as a sort of reminder to me on what I thought of them at a particular point in time. They are not predictions and none should rely on them for any investment decisions.
